
Page 38 - IJB-5-2
P. 38
A novel inkjet system for live cell bioprinting
A B
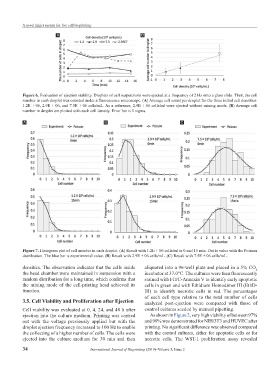
Figure 6. Evaluation of ejection stability. Droplets of cell suspensions were ejected at a frequency of 2 Hz onto a glass slide. Then, the cell
number in each droplet was counted under a fluorescence microscope. (A) Average cell count per droplet for the three initial cell densities:
1.2E + 06, 2.9E + 06, and 7.5E + 06 cells/mL. As a reference, 2.9E + 06 cells/ml were ejected without mixing mode. (B) Average cell
number in droplet are plotted with each cell density. Error bar is 1 sigma.
A B C
Figure 7. Histogram plot of cell number in each droplet. (A) Result with 1.2E + 06 cells/ml in 0 and 15 min. Dot is value with the Poisson
distribution. The blue bar is experimental value. (B) Result with 2.9E + 06 cells/mL. (C) Result with 7.5E + 06 cells/mL.
densities. The observation indicates that the cells inside aliquoted into a 96-well plate and placed in a 5% CO
2
the head chamber were maintained in suspension with a incubator at 37.0°C. The cultures were then fluorescently
random distribution for a long time, which confirms that stained with FITC-Annexin V to identify early apoptotic
the mixing mode of the cell-printing head achieved its cells in green and with Ethidium Homodimer III (EthD-
function. III) to identify necrotic cells in red. The percentages
of each cell type relative to the total number of cells
3.5. Cell Viability and Proliferation after Ejection analyzed post-ejection were compared with those of
Cell viability was evaluated at 0, 4, 24, and 48 h after control cultures seeded by manual pipetting.
ejection into the culture medium. Printing was carried As shown in Figure 2, very high viability of between 97%
out with the voltage previously applied but with the and 99% was demonstrated for NIH/3T3 and HUVEC after
droplet ejection frequency increased to 100 Hz to enable printing. No significant difference was observed compared
the collecting of a higher number of cells. The cells were with the control cultures, either for apoptotic cells or for
ejected into the culture medium for 30 min and then necrotic cells. The WST-1 proliferation assay revealed
34 International Journal of Bioprinting (2019)–Volume 5, Issue 2