
Page 55 - IJB-5-2
P. 55
Shuai C, et al.
A B C
D E F
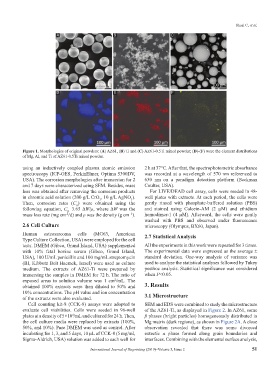
Figure 1. Morphologies of original powders: (A) AZ61, (B) Ti and (C) AZ61-0.5Ti mixed powder; (D)-(F) were the element distributions
of Mg, Al, and Ti of AZ61-0.5Ti mixed powder.
using an inductively coupled plasma atomic emission 2 h at 37°C. After that, the spectrophotometric absorbance
spectroscopy (ICP-OES, PerkinElmer, Optima 5300DV, was recorded at a wavelength of 570 nm referenced to
USA). The corrosion morphologies after immersion for 2 630 nm on a paradigm detection platform (Beckman
and 7 days were characterized using SEM. Besides, mass Coulter, USA).
loss was obtained after removing the corrosion products For LIVE/DEAD cell assay, cells were seeded in 48-
in chromic acid solution (200 g/L CrO , 10 g/L AgNO ). well plates with extracts. At each period, the cells were
3
3
Then, corrosion rates (C ) were obtained using the gently rinsed with phosphate-buffered solution (PBS)
R
following equation, C =3.65 ∆W/ρ, where ∆W was the and stained using Calcein-AM (2 µM) and ethidium
R
mass loss rate (mg cm /d) and ρ was the density (g cm ). homodimer-1 (4 µM). Afterward, the cells were gently
−3
-2
washed with PBS and observed under fluorescence
2.6 Cell Culture microscopy (Olympus, BX60, Japan).
Human osteosarcoma cells (MG63, American 2.7 Statistical Analysis
Type Culture Collection, USA) were employed for the cell
tests. DMEM (Gibco, Grand Island, USA) supplemented All the experiments in this work were repeated for 3 times.
with 10% fetal bovine serum (Gibco, Grand Island, The experimental data were expressed as the average ±
USA), 100 U/mL penicillin and 100 mg/mL streptomycin standard deviation. One-way analysis of variance was
(BI, Kibbutz Beit Haemek, Israel) were used as culture used to analyze the statistical analyses followed by Tukey
medium. The extracts of AZ61-Ti were prepared by posthoc analysis. Statistical significance was considered
immersing the samples in DMEM for 72 h. The ratio of when P<0.05.
exposed areas to solution volume was 1 cm /mL. The
2
obtained 100% extracts were then diluted to 50% and 3. Results
10% concentrations. The pH value and ion concentration 3.1 Microstructure
of the extracts were also evaluated.
Cell counting kit-8 (CCK-8) assays were adopted to SEM and EDS were combined to study the microstructure
evaluate cell viabilities. Cells were seeded in 96-well of the AZ61-Ti, as displayed in Figure 2. In AZ61, some
plates at a density of 5×10 /mL and cultured for 24 h. Then, β phases (bright particles) homogeneously distributed in
4
the cell culture media were replaced by extracts (100%, Mg matrix (dark regions), as shown in Figure 2A. A close
50%, and 10%). Pure DMEM was used as control. After observation revealed that there was some divorced
incubating for 1, 3, and 5 days, 10 µL of CCK-8 (5 mg/ml, eutectic α phase formed along grain boundaries and
Sigma-Aldrich, USA) solution was added to each well for interfaces. Combining with the elemental surface analysis,
International Journal of Bioprinting (2019)–Volume 5, Issue 2 51