
Page 58 - IJB-5-2
P. 58
A continuous net-like eutectic structure enhances the corrosion resistance of Mg alloys
cracks appeared on the surface were due to the shrinkage decreased to 7.89 (Figure 7A). The Mg releasing during
2+
of the corrosion product layer during dehydration. It was the incubation reflected the degradation rate of AZ61-Ti
obvious that AZ61 suffered the most severe corrosion, in the culture medium. AZ61-0.5Ti showed the lowest
which was consistent with its fastest degradation rate Mg concentration, indicating its optimal corrosion
2+
(Figure 6A). As a comparison, AZ61-0.5Ti suffered resistance. The Zn concentrations in the extracts were in
2+
homogeneous corrosion, as depicted in Figure 6C. Some the single-digit µg/mL range (Figure 7B). In addition, Al
3+
particles were deposited on this layer, which was enriched concentrations in all the extracts were not detected, due
in Mg, Ca, P, C, and O (area 2), with a higher content of to the small solubility products of aluminum hydroxide
Ca and P than that on area 1 (Figure 6F). Nevertheless, (1.3×10 ) .
−33 [21]
AZ61-0.75Ti and AZ61-1.0Ti both suffered severely The cell viability of the MG63 incubated in AZ61-Ti
localized corrosion. With increasing immersion period to extracts is depicted in Figure 7c. After 3 days’ culture, all
7 days, the AZ61-0.5Ti was also compact, except for some the undiluted extracts (100%) resulted in a significantly
micro-cracks and particles on the surface. Large cracks reduced cell viability compared to the negative control.
and flaking of corrosion product could be observed on However, the toxic effects could be mitigated by dilution.
AZ61 and AZ61-1.0Ti. The flaking of corrosion products The cell viability was about 90% for AZ61-0.5Ti in 50%
resulted from the thickening of the corrosion layer and extracts, suggesting the AZ61-0.5Ti alloy had good cell
dehydration process . compatibility. The cell viability level was further improved
[20]
with 10% extract dilution. The cell viability was improved
3.3 Cytotoxicity with extract dilution which may be in consonance with
The pH and ion concentration of the extracts during the the clinical condition in which the material becomes
72 h incubation is summarized in Figures 7A and B. There diluted with the surrounding tissue fluid . According
[22]
were no significant differences in the pH of the 100% to ISO 10993-5, all the samples showed acceptable cell
extracts (all closing to 9). The pH only slightly reduced viabilities, which were higher than 80% [23-25] .
in 50% extracts due to the buffer effect of the culture LIVE/DEAD staining assay was further used to
medium. When further diluted to 10%, the pH values were evaluate the biocompatibility (Figure 8). Obviously, all
A B
C D
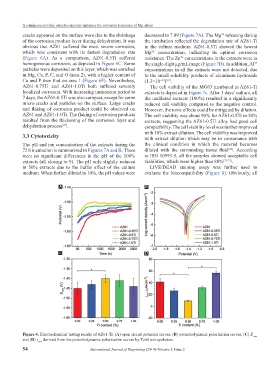
Figure 4. Electrochemical testing results of AZ61-Ti: (A) open circuit potential curves, (B) potentiodynamic polarization curves, (C) E corr
and (D) i corr derived from the potentiodynamic polarization curves by Tafel extrapolation.
54 International Journal of Bioprinting (2019)–Volume 5, Issue 2