
Page 57 - IJB-5-2
P. 57
Shuai C, et al.
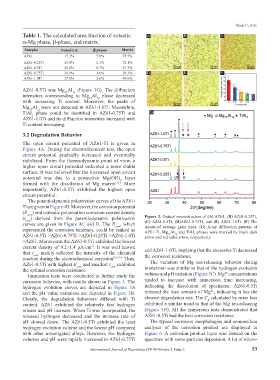
Table 1. The calculated area fraction of eutectic A B C
α-Mg phase, β-phase, and matrix.
Samples Eutectic α β phases Matrix
AZ61 17.3% 7.0% 75.7%
AZ61-0.25Ti 25.8% 2.1% 72.1%
AZ61-0.5Ti 42.0% 0.7% 57.3%
AZ61-0.75Ti 36.1% 1.6% 50.3% D E F
AZ61-1.0Ti 27.8% 2.6% 69.6%
AZ61-0.5Ti was Mg Al (Figure 3G). The diffraction
12
17
intensities corresponding to Mg Al phase decreased
12
17
with increasing Ti content. Moreover, the peaks of
Mg Al were not detected in AZ61-1.0Ti. Meanwhile,
17
12
TiAl phase could be identified in AZ61-0.75Ti and G
3
AZ61-1.0Ti and its diffraction intensities increased with
Ti content increasing.
3.2 Degradation Behavior
The open circuit potential of AZ61-Ti is given in
Figure 4A. During the electrochemical test, the open
circuit potential gradually increased and eventually
stabilized. From the thermodynamic point of view, a
higher open circuit potential indicated a more stable
surface. It was believed that the increased open circuit
potential was due to a protective Mg(OH) layer
2
formed with the dissolution of Mg matrix [17] . More
importantly, AZ61-0.5Ti exhibited the highest open
circuit potential.
The potentiodynamic polarization curves of the AZ61-
Ti are given in Figure 4B. Moreover, the corrosion potential
(E corr ) and cathodic polarization corrosion current density
(i corr ) derived from the potentiodynamic polarization Figure 3. Optical microstructure of (A) AZ61, (B) AZ61-0.25Ti,
curves are given in Figure 4C and D. The E corr , which (C) AZ61-0.5Ti, (D)AZ61-0.75Ti, and (E) AZ61-1.0Ti. (F) The
measured average grain sizes. (G) X-ray diffraction patterns of
represented the corrosion tendency, could be ranked as AZ61-Ti. Mg Al and TiAl phases were marked by black dash
AZ61-0.5Ti >AZ61-0.75Ti >AZ61-0.25Ti >AZ61-1.0Ti arrow and red solid arrow, respectively.
17
12
3
>AZ61. Moreoverm the AZ61-0.5Ti exhibited the lowest
current density of 9.2±1.4 μA·cm . It was well known and AZ61-1.0Ti, implying that the excessive Ti decreased
-2
that i corr mainly reflected the intensity of the chemical
reaction during the electrochemical corrosion [18,19] . Thus, the corrosion resistance.
AZ61-0.5Ti with highest E corr and smallest i corr exhibited The variation of Mg ion-releasing behavior during
the optimal corrosion resistance. immersion was similar to that of the hydrogen evolution
2+
Immersion tests were conducted to further study the volume and pH variation (Figure 5C). Mg concentrations
corrosion behavior, with results shown in Figure 5. The tended to increase with immersion time increasing,
hydrogen evolution curves are depicted in Figure 5A indicating the dissolution of specimens. AZ61-0.5Ti
2+
and the pH value variations are depicted in Figure 5B. released the least amount of Mg , indicating it has the
Clearly, the degradation behaviors differed with Ti slowest degradation rate. The C calculated by mass loss
R
content. AZ61 exhibited the relatively fast hydrogen exhibited a similar trend to that of the Mg ion-releasing
release and pH increase. When Ti was incorporated, the (Figure 5D). All the immersion tests demonstrated that
released hydrogen decreased and the increase rate of AZ61-0.5Ti had the best corrosion resistance.
pH slowed down. The AZ61-0.5Ti exhibited the least The typical corrosion morphologies and composition
hydrogen evolution volume and the lowest pH compared analyses of the corrosion product are displayed in
with other investigated alloys. However, the hydrogen Figure 6. A corrosion product layer was formed on the
volumes and pH were rapidly increased in AZ61-0.75Ti specimen with some particles deposition. A lot of micro-
International Journal of Bioprinting (2019)–Volume 5, Issue 2 53