
Page 197 - IJB-10-5
P. 197
International Journal of Bioprinting Structural design of D-surface scaffolds
3.2. Load-carrying capacity of graded curves increased steadily with increasing displacement,
D-surface structures suggesting a plastic deformation of the D-surface samples.
3.2.1. Compressive behavior of uniform and graded Uniform D-surface samples with 1.2 mm thickness
D-surface structures from center to outer edge could withstand an enhanced compressive force during
The load-carrying and energy absorption capacity are the whole compressive process (Figure 4a and c). The
important factors when applied as tissue engineering load-bearing capacity also increased with increasing
scaffolds to ensure sufficient support at bone defect sites. wall thickness. Furthermore, the designed samples could
Therefore, the compression performance of uniform and withstand a higher compressive force in contrast with the
graded D-surface structures was assessed accordingly. Two uniform samples of the same relative density (Figure 4b
gradient design patterns were considered, including a radial and d). This is mainly attributed to the larger thickness
and a vertical pattern (Figure 1). The former is similar to in the outer edge providing support under external force,
the natural bone, with outer cortical and inner cancellous similar to the pressure of natural bone. Accordingly,
bone structures. Figure 4 indicates the compression force– the biomimetic D-surface structure provides good
displacement curves of uniform and graded D-surface deformation resistance and possesses superior mechanical
cylindrical samples. Since PBAT/PLA possesses excellent performance, making these structures ideal candidates as
31
ductility, the compression tests were terminated at a tissue scaffolds.
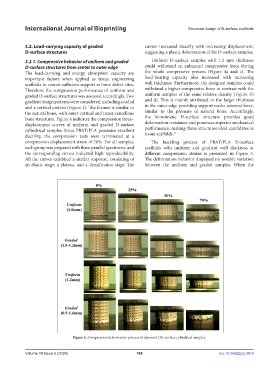
compression displacement strain of 70%. For all samples, The buckling process of PBAT/PLA D-surface
each group was prepared with three parallel specimens, and scaffolds with uniform and gradient wall thickness at
the corresponding curves indicated high reproducibility. different compression strains is presented in Figure 5.
All the curves exhibited a similar response, consisting of The deformation behavior displayed no notable variation
an elastic stage, a plateau, and a densification stage. The between the uniform and graded samples. When the
Figure 5. Compression deformation process of diamond (D)-surface cylindrical samples.
Volume 10 Issue 5 (2024) 189 doi: 10.36922/ijb.3416