
Page 198 - IJB-10-5
P. 198
International Journal of Bioprinting Structural design of D-surface scaffolds
compression force is loaded, the D-surface samples relative density. For example, the SEA value of graded
demonstrated an overall bulky deformation mechanism, D-surface samples was 8313.30 J/g, which was 23% higher
revealing good stress transfer throughout the sample. than that of the uniform control with 1.2 mm. This was
No obvious cracking or brittle breaking was observed, mainly due to thicker-edged samples providing stronger
suggesting the good toughness of the PBAT/PLA material. support against the external compression force.
Based on the compression force–displacement curves, 3.2.2. Compressive behavior of uniform and graded
the total energy absorption (EA) represents the total energy D-surface structures from top to bottom
absorbed during the entire compression process, and the The second gradient pattern for the graded D-surfaces
specific energy absorption (SEA) per unit mass of lattice is a cubic structure with gradient thickness from top
structures is calculated using the following equations: to bottom. The sparse structure at one end would be
more suitable to be applied as the cancellous femur
EA = d Fdδ (2) head structure. To explore the gradient thickness on the
∫ 0 compression performance, three thickness gradients,
including 0.6–1.8, 0.8–1.6, and 1.0–1.4 mm, were
adopted in contrast with the control having a thickness of
EA
SEA = m (3) 1.2 mm. The force–displacement curves and histograms
of SEA values are displayed in Figure 7. All graded
samples exhibited better compression performance
where F is the compression force, δ is the displacement, than the uniform sample. In general, the plateau stage
d is the final displacement, and m is the mass of the lattice corresponded to the main compression load and the most
structures. energy absorbed. In Figure 7a, the plateau region of graded
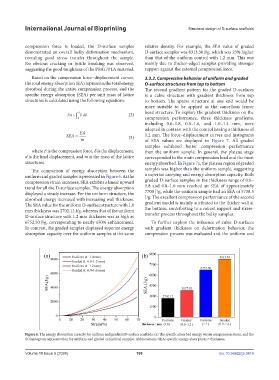
The comparison of energy absorption between the samples was higher than the uniform sample, suggesting
uniform and graded samples is presented in Figure 6. As the a superior carrying and energy absorption capacity. Both
compression strain increases, SEA exhibits a linear upward graded D-surface samples in the thickness range of 0.6–
trend for all the D-surface samples. The energy absorption 1.8 and 0.8–1.6 mm reached an SEA of approximately
displayed a steady increase. For the uniform structure, the 7700 J/g, while the uniform sample had an SEA of 5738.3
absorbed energy increased with increasing wall thickness. J/g. The excellent compression performance of the second
The SEA value for the uniform D-surface structure with 1.0 gradient model is mainly attributed to the thicker wall at
mm thickness was 2702.12 J/g, whereas that of the uniform the bottom, contributing to a robust support and stress-
D-surface structure with 1.2 mm thickness was as high as transfer process throughout the bulky samples.
6752.50 J/g, corresponding to nearly 150% enhancement. To further explore the influence of cubic D-surfaces
In contrast, the graded samples displayed superior energy with gradient thickness on deformation behavior, the
absorption capacity over the uniform samples at the same compression process was evaluated and the uniform and
Figure 6. The energy absorption capacity for uniform and gradient D-surface scaffolds. (a) The specific absorbed energy versus compression strain, and the
(b) histogram representation for uniform and graded cylindrical samples. Abbreviations: SEA: specific energy absorption; t: thickness.
Volume 10 Issue 5 (2024) 190 doi: 10.36922/ijb.3416