
Page 199 - IJB-10-5
P. 199
International Journal of Bioprinting Structural design of D-surface scaffolds
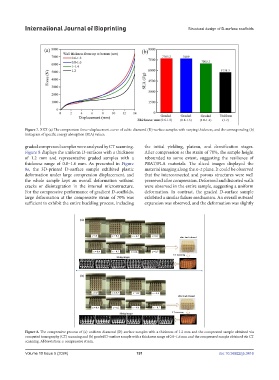
Figure 7. XXX (a) The compression force–displacement curve of cubic diamond (D)-surface samples with varying thickness, and the corresponding (b)
histogram of specific energy absorption (SEA) values.
graded compressed samples were analyzed by CT scanning. the initial yielding, plateau, and densification stages.
Figure 8 displays the uniform D-surfaces with a thickness After compression at the strain of 70%, the sample height
of 1.2 mm and representative graded samples with a rebounded to some extent, suggesting the resilience of
thickness range of 0.8–1.6 mm. As presented in Figure PBAT/PLA materials. The sliced images displayed the
8a, the 3D-printed D-surface sample exhibited plastic material imaging along the x–z plane. It could be observed
deformation under large compression displacement, and that the interconnected and porous structures were well
the whole sample kept an overall deformation without preserved after compression. Deformed and distorted walls
cracks or disintegration in the internal microstructure. were observed in the entire sample, suggesting a uniform
For the compressive performance of gradient D-scaffolds, deformation. In contrast, the graded D-surface sample
large deformation at the compressive strain of 70% was exhibited a similar failure mechanism. An overall outward
sufficient to exhibit the entire buckling process, including expansion was observed, and the deformation was slightly
Figure 8. The compressive process of (a) uniform diamond (D)-surface samples with a thickness of 1.2 mm and the compressed sample obtained via
computed tomography (CT) scanning and (b) graded D-surface sample with a thickness range of 0.8–1.6 mm and the compressed sample obtained via CT
scanning. Abbreviation: ε: compressive strain.
Volume 10 Issue 5 (2024) 191 doi: 10.36922/ijb.3416