
Page 215 - IJB-10-5
P. 215
International Journal of Bioprinting Biomimetic osteochondral scaffold
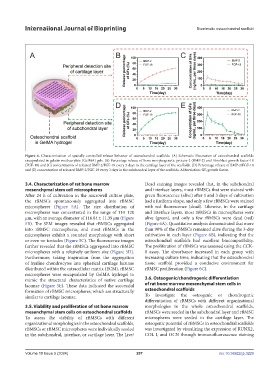
Figure 4. Characterization of spatially controlled release behavior of osteochondral scaffolds. (A) Schematic illustration of osteochondral scaffolds
encapsulated in gelatin methacrylate (GelMA) gels. (B) Percentage release of bone morphogenetic protein-2 (BMP-2) and fibroblast growth factor-18
(FGF-18) and (C) concentration of released BMP-2/FGF-18 every 3 days in the cartilage layer of the scaffolds. (D) Percentage release of BMP-2/FGF-18
and (E) concentration of released BMP-2/FGF-18 every 3 days in the subchondral layer of the scaffolds. Abbreviation: GF, growth factor.
3.4. Characterization of rat bone marrow Dead staining images revealed that, in the subchondral
mesenchymal stem cell microspheres and interface layers, most rBMSCs that were stained with
After 24 h of cultivation in the microwell culture plate, green fluorescence (alive) after 1 and 3 days of cultivation
the rBMSCs spontaneously aggregated into rBMSC had a fusiform shape, and only a few rBMSCs were stained
microspheres (Figure 5A). The size distribution of with red fluorescence (dead). Likewise, in the cartilage
microspheres was concentrated in the range of 110–120 and interface layers, most rBMSCs in microspheres were
μm, with an average diameter of 116.84 ± 11.39 μm (Figure alive (green), and only a few rBMSCs were dead (red)
5B). The SEM images revealed that rBMSCs aggregated (Figure 6A). Quantitative analysis demonstrated that more
into rBMSC microspheres, and most rBMSCs in the than 90% of the rBMSCs remained alive during the 3-day
microspheres exhibit a rounded morphology with short cultivation in each layer (Figure 6B), indicating that the
or even no tentacles (Figure 5C). The fluorescence images osteochondral scaffolds had excellent biocompatibility.
further revealed that the rBMSCs aggregated into rBMSC The proliferation of rBMSCs was assessed using the CCK-
microspheres with a relatively uniform size (Figure 5D). 8 assay. The absorbance increased in each group with
Furthermore, taking inspiration from the aggregation increasing culture time, indicating that the osteochondral
of hyaline chondrocytes into spherical cartilage lacunae tissue scaffold provided a conducive environment for
distributed within the extracellular matrix (ECM), rBMSC rBMSC proliferation (Figure 6C).
microspheres were encapsulated by GelMA hydrogel to
mimic the structural characteristics of native cartilage 3.6. Osteogenic/chondrogenic differentiation
lacunae (Figure 5E). These data indicated the successful of rat bone marrow mesenchymal stem cells in
formation of rBMSC microspheres, which are structurally osteochondral scaffolds
similar to cartilage lacunae. To investigate the osteogenic or chondrogenic
differentiation of rBMSCs with different organizational
3.5. Viability and proliferation of rat bone marrow morphologies in the whole osteochondral scaffolds,
mesenchymal stem cells on osteochondral scaffolds rBMSCs were seeded in the subchondral layer and rBMSC
To assess the viability of rBMSCs with different microspheres were seeded in the cartilage layer. The
organizational morphologies in the osteochondral scaffolds, osteogenic potential of rBMSCs in osteochondral scaffolds
rBMSCs or rBMSC microspheres were individually seeded was investigated by visualizing the expression of RUNX2,
in the subchondral, interface, or cartilage layer. The Live/ COL I, and OCN through immunofluorescence staining
Volume 10 Issue 5 (2024) 207 doi: 10.36922/ijb.3229