
Page 217 - IJB-10-5
P. 217
International Journal of Bioprinting Biomimetic osteochondral scaffold
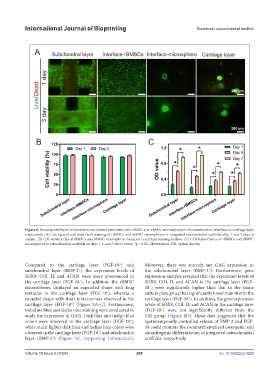
Figure 6. Biocompatibility of rat bone marrow mesenchymal stem cells (rBMSCs) or rBMSC microspheres in the subchondral, interface, or cartilage layer,
respectively. (A) Live (green) and dead (red) staining of rBMSCs and rBMSC microspheres in integrated osteochondral scaffolds after 1 and 3 days of
culture. (B) Cell viability (%) of rBMSCs and rBMSC microspheres based on Live/Dead staining analysis. (C) CCK8 absorbance of rBMSCs and rBMSC
microspheres in osteochondral scaffolds on days 1, 4, and 7 after culture. *p < 0.05. Abbreviation: OD, optical density.
Compared to the cartilage layer (FGF-18 ) and Moreover, there was scarcely any GAG expression in
−
subchondral layer (BMP-2 ), the expression levels of the subchondral layer (BMP-2 ). Furthermore, gene
+
+
SOX9, COL II, and ACAN were more pronounced in expression analysis revealed that the expression levels of
the cartilage layer (FGF-18 ). In addition, the rBMSC SOX9, COL II, and ACAN in the cartilage layer (FGF-
+
microspheres displayed an expanded shape with long 18 ) were significantly higher than that in the tissue
−
tentacles in the cartilage layer (FGF-18 ), whereas a culture plate group but significantly lower than that in the
−
rounded shape with short tentacles was observed in the cartilage layer (FGF-18 ). In addition, the gene expression
+
cartilage layer (FGF-18 ) (Figure 8A–C). Furthermore, levels of SOX9, COL II, and ACAN in the cartilage layer
+
toluidine blue and alcian blue staining were conducted to (FGF-18 ) were not significantly different from the
+
study the expression of GAG. Dark blue and indigo blue CM group (Figure 8D). These data suggested that the
colors were observed in the cartilage layer (FGF-18 ), spatiotemporally controlled release of BMP-2 and FGF-
+
while much lighter dark blue and indigo blue colors were 18 could promote the compartmentalized osteogenic and
observed in the cartilage layer (FGF-18 ) and subchondral chondrogenic differentiation of integrated osteochondral
−
layer (BMP-2 ) (Figure S2, Supporting Information). scaffolds, respectively.
+
Volume 10 Issue 5 (2024) 209 doi: 10.36922/ijb.3229