
Page 274 - IJB-10-5
P. 274
International Journal of Bioprinting A TPMS framework for complete dentures
concentration area is roughly the same as the equivalent
plastic strain area, indicating that plastic deformation
will occur first in these areas. The stress concentration
areas of these porous models mainly concentrate on the
junctions between unit cells. These regions have smaller
cross-sectional areas and are prone to deformation when
subjected to external forces. In terms of stress distribution,
B-I exhibits a more uniform stress distribution and the
smallest maximum equivalent stress.
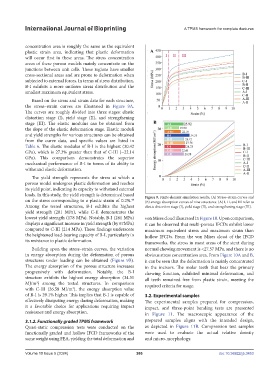
Based on the stress and strain data for each structure,
the stress–strain curves are illustrated in Figure 9A.
The curves are roughly divided into three stages: elastic
distortion stage (I), yield stage (II), and strengthening
stage (III). The elastic modulus can be obtained from
the slope of the elastic deformation stage. Elastic moduli
and yield strengths for various structures can be obtained
from the curve data, and specific values are listed in
Table 6. The elastic modulus of B-I is the highest (30.42
GPa), which is 27.3% greater than that of C-III (~22.14
GPa). This comparison demonstrates the superior
mechanical performance of B-I in terms of its ability to
withstand elastic deformation.
The yield strength represents the stress at which a
porous model undergoes plastic deformation and reaches
its yield point, indicating its capacity to withstand external
loads. In this study, the yield strength is determined based Figure 9. Finite element simulation results. (A) Stress–strain curves and
on the stress corresponding to a plastic strain of 0.2%. (B) energy absorption curves of nine structures. (A) I, II, and III refer to
44
Among the tested structures, B-I exhibits the highest elastic distortion stage (I), yield stage (II), and strengthening stage (III).
yield strength (281 MPa), while C-II demonstrates the
lowest yield strength (178 MPa). Notably, B-I (281 MPa) von Mises cloud illustrated in Figure 10. Upon comparison,
displays a significant increase in yield strength (by 67MPa) it can be observed that multi-porous IFCDs exhibit lower
compared to C-III (214 MPa). These findings underscore maximum equivalent stress and maximum strain than
the heightened load-bearing capacity of B-I, particularly in hollow IFCDs. From the von Mises cloud of the IFCD
its resistance to plastic deformation. frameworks, the stress in most areas of the stent during
Building upon the stress–strain curves, the variation normal chewing movement is <27.57 MPa, and there is no
in energy absorption during the deformation of porous obvious stress concentration area. From Figure 10A and B,
structures under loading can be obtained (Figure 9B). it can be seen that the deformation is mainly concentrated
The energy absorption of the porous structure increases in the incisors. The molar teeth that bear the primary
progressively with deformation. Notably, the B-I chewing function, exhibited minimal deformation, and
structure exhibits the highest energy absorption (34.31 all teeth remained free from plastic strain, meeting the
MJ/m ) among the tested structures. In comparison required criteria for usage.
3
with C-III (26.58 MJ/m ), the energy absorption value
3
of B-I is 29.1% higher. This implies that B-I is capable of 3.2. Experimental samples
effectively dissipating energy during deformation, making The experimental samples prepared for compression,
it a favorable choice for applications requiring impact impact, and three-point bending tests are presented
resistance and energy absorption. in Figure 11. The macroscopic appearance of the
3.1.2. Functionally graded TPMS framework prepared samples aligns with the intended design,
Quasi-static compression tests were conducted on the as depicted in Figure 11B. Compression test samples
functionally graded and hollow IFCD frameworks of the were used to evaluate the actual relative density
same weight using FEA, yielding the total deformation and and micro-morphology.
Volume 10 Issue 5 (2024) 266 doi: 10.36922/ijb.3453