
Page 278 - IJB-10-5
P. 278
International Journal of Bioprinting A TPMS framework for complete dentures
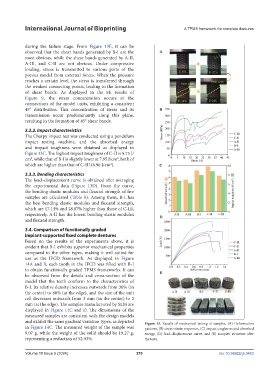
during the failure stage. From Figure 13E, it can be
observed that the shear bands generated by B-I are the
most obvious, while the shear bands generated by A-II,
A-III, and C-II are not obvious. Under compressive
loading, stress is transmitted to various parts of the
porous model from external forces. When the pressure
reaches a certain level, the stress is transferred through
the weakest connecting points, leading to the formation
of shear bands. As displayed in the FE results of
Figure 9, the stress concentration occurs at the
connections of the model units, exhibiting a consistent
45° distribution. This concentration of stress and its
transmission occur predominantly along this plane,
resulting in the formation of 45° shear bands.
3.3.2. Impact characteristics
The Charpy impact test was conducted using a pendulum
impact testing machine, and the absorbed energy
and impact toughness were obtained as displayed in
Figure 13C. The highest impact toughness of C-II is 8.75 J/
cm , while that of B-I is slightly lower at 7.95 J/cm , both of
2
2
which are higher than that of C-III (6.96 J/cm ).
2
3.3.3. Bending characteristics
The load–displacement curve is obtained after averaging
the experimental data (Figure 13D). From the curve,
the bending elastic modulus and flexural strength of five
samples are calculated (Table 8). Among them, B-I has
the best bending elastic modulus and flexural strength,
which are 17.14% and 28.87% higher than those of C-III,
respectively. A-II has the lowest bending elastic modulus
and flexural strength.
3.4. Comparison of functionally graded
implant-supported fixed complete dentures
Based on the results of the experiments above, it is
evident that B-I exhibits superior mechanical properties
compared to the other types, making it well-suited for
use as the IFCD framework. As displayed in Figure
14A and B, each tooth in the IFCD was filled with B-I
to obtain functionally graded TPMS frameworks. It can
be observed from the details and cross-section of the
model that the teeth conform to the characteristics of
B-I. Its relative density increases outwards from 30% (in
the center) to 60% (at the edge), and the size of the unit
cell decreases outwards from 3 mm (in the center) to 2
mm (at the edge). The samples manufactured by SLM are
displayed in Figure 14C and D. The dimensions of the
measured samples are consistent with the design models
and exhibit the same gradient variation types, as depicted Figure 13. Results of mechanical testing of samples. (A) Deformation
in Figure 14C. The measured weight of the sample was patterns, (B) stress–strain responses, (C) impact toughness and absorbed
9.07 g, while the weight of the solid should be 19.27 g, energy, (D) load–displacement curve, and (E) samples’ structure after
representing a reduction of 52.93%. the tests.
Volume 10 Issue 5 (2024) 270 doi: 10.36922/ijb.3453