
Page 307 - IJB-10-5
P. 307
International Journal of Bioprinting Proteins-loaded 3D-printed PEEK cage
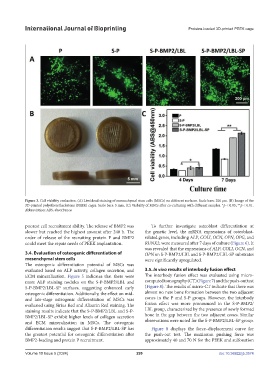
Figure 3. Cell viability evaluation. (A) Live/dead staining of mesenchymal stem cells (MSCs) on different surfaces. Scale bars: 200 μm. (B) Image of the
3D-printed polyetheretherketone (PEEK) cages. Scale bars: 5 mm. (C) Viability of MSCs after co-culturing with different samples. *p < 0.05; **p < 0.01.
Abbreviation: ABS, absorbance.
poorest cell recruitment ability. The release of BMP2 was To further investigate osteoblast differentiation at
slower but reached the highest amount after 240 h. The the genetic level, the mRNA expressions of osteoblast-
order of release of the recruiting protein P and BMP2 related genes, including ALP, COLI, OCN, OPN, OPG, and
could meet the repair needs of PEEK implantation. RUNX2, were measured after 7 days of culture (Figure 6). It
was revealed that the expressions of ALP, COLI, OCN, and
3.4. Evaluation of osteogenic differentiation of OPN on S-P-BMP2/LBL and S-P-BMP2/LBL-SP substrates
mesenchymal stem cells were significantly upregulated.
The osteogenic differentiation potential of MSCs was
evaluated based on ALP activity, collagen secretion, and 3.5. In vivo results of interbody fusion effect
ECM mineralization. Figure 5 indicates that there were The interbody fusion effect was evaluated using micro-
more ALP staining nodules on the S-P-BMP2/LBL and computed tomography (CT) (Figure 7) and the push-out test
S-P-BMP2/LBL-SP surfaces, suggesting enhanced early (Figure 8). The results of micro-CT indicate that there was
osteogenic differentiation. Additionally, the effect on mid- almost no new bone formation between the two adjacent
and late-stage osteogenic differentiation of MSCs was cones in the P and S-P groups. However, the interbody
evaluated using Sirius Red and Alizarin Red staining. The fusion effect was more pronounced in the S-P-BMP2/
staining results indicate that the S-P-BMP2/LBL and S-P- LBL group, characterized by the presence of newly formed
BMP2/LBL-SP exhibit higher levels of collagen secretion bone in the gap between the two adjacent cones. Similar
and ECM mineralization in MSCs. The osteogenic observations were noted for the S-P-BMP2/LBL-SP group.
differentiation results suggest that S-P-BMP2/LBL-SP has Figure 8 displays the force–displacement curve for
the greatest potential for osteogenic differentiation after the push-out test. The maximum pushing force was
BMP2-loading and protein P recruitment. approximately 40 and 70 N for the PEEK and sulfonation
Volume 10 Issue 5 (2024) 299 doi: 10.36922/ijb.3574