
Page 448 - IJB-10-5
P. 448
International Journal of Bioprinting Bioprinting for large-sized tissue delivery
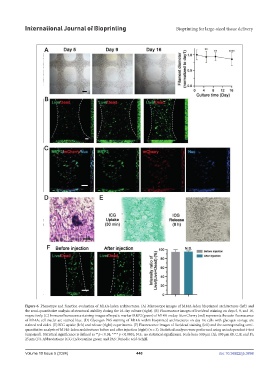
Figure 6. Phenotype and function evaluation of M14A-laden architectures. (A) Microscope images of M14A-laden bioprinted architectures (left) and
the semi-quantitative analysis of structural stability during the 16-day culture (right). (B) Fluorescence images of live/dead staining on days 5, 9, and 16,
respectively. (C) Immunofluorescence staining images of hepatic marker MRP2 (green) of M14A on day 16; mCherry (red) represents the auto-fluorescence
of M14A; cell nuclei are stained blue. (D) Glycogen PAS staining of M14A within bioprinted architectures on day 16; cells with glycogen storage are
stained red violet. (E) ICG uptake (left) and release (right) experiments. (F) Fluorescence images of live/dead staining (left) and the corresponding semi-
quantitative analysis of M14A-laden architectures before and after injection (right) (n = 3). Statistical analyses were performed using an independent t-test
(unpaired). Statistical significance is defined as **p < 0.01; **** p < 0.0001; N.S.: no statistical significance. Scale bars: 500 μm (A); 100 μm (B, C, E, and F);
25 μm (D). Abbreviations: ICG: Indocyanine green; and PAS: Periodic acid-Schiff.
Volume 10 Issue 5 (2024) 440 doi: 10.36922/ijb.3898