
Page 82 - IJB-6-1
P. 82
Hydrolytic expansion accelerates Fe biodegradation
A B C
D E F
G
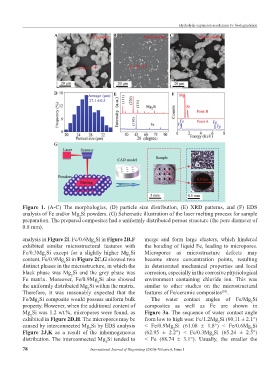
Figure 1. (A-C) The morphologies, (D) particle size distribution, (E) XRD patterns, and (F) EDS
analysis of Fe and/or Mg Si powders. (G) Schematic illustration of the laser melting process for sample
2
preparation. The prepared composites had a uniformly distributed porous structure (the pore diameter of
0.8 mm).
analysis in Figure 2I. Fe/0.6Mg Si in Figure 2B,F merge and form large clusters, which hindered
2
exhibited similar microstructural features with the bonding of liquid Fe, leading to micropores.
Fe/0.3Mg Si except for a slightly higher Mg Si Micropores as microstructure defects may
2
2
content. Fe/0.9Mg Si in Figure 2C,G showed two become stress concentration points, resulting
2
distinct phases in the microstructure, in which the in deteriorated mechanical properties and local
black phase was Mg Si and the grey phase was corrosion, especially in the corrosive physiological
2
Fe matrix. Moreover, Fe/0.9Mg Si also showed environment containing chloride ion. This was
2
the uniformly distributed Mg Si within the matrix. similar to other studies on the microstructural
2
Therefore, it was reasonably expected that the features of Fe/ceramic composites .
[34]
Fe/Mg Si composite would possess uniform bulk The water contact angles of Fe/Mg Si
2
2
property. However, when the additional content of composites as well as Fe are shown in
Mg Si was 1.2 wt.%, micropores were found, as Figure 3a. The sequence of water contact angle
2
exhibited in Figure 2D,H. The micropores may be from low to high was: Fe/1.2Mg Si (60.11 ± 2.1°)
2
caused by interconnected Mg Si by EDS analysis < Fe/0.9Mg Si (61.08 ± 1.8°) < Fe/0.6Mg Si
2
2
2
Figure 2J,K as a result of the inhomogeneous (62.95 ± 2.2°) < Fe/0.3Mg Si (65.24 ± 2.5°)
2
distribution. The interconnected Mg Si tended to < Fe (68.74 ± 3.1°). Usually, the smaller the
2
78 International Journal of Bioprinting (2020)–Volume 6, Issue 1