
Page 87 - IJB-6-1
P. 87
Shuai, et al.
A B C D E
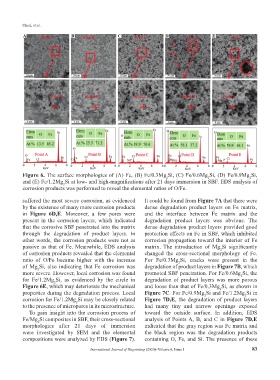
Figure 6. The surface morphologies of (A) Fe, (B) Fe/0.3Mg Si, (C) Fe/0.6Mg Si, (D) Fe/0.9Mg Si,
2
2
2
and (E) Fe/1.2Mg Si at low- and high-magnifications after 21 days immersion in SBF. EDS analysis of
2
corrosion products was performed to reveal the elemental ratios of O/Fe.
suffered the most severe corrosion, as evidenced It could be found from Figure 7A that there were
by the existence of many more corrosion products dense degradation product layers on Fe matrix,
in Figure 6D,E. Moreover, a few pores were and the interface between Fe matrix and the
present in the corrosion layers, which indicated degradation product layers was obvious. The
that the corrosive SBF penetrated into the matrix dense degradation product layers provided good
through the degradation of product layers. In protection effects on Fe in SBF, which inhibited
other words, the corrosion products were not as corrosion propagation toward the interior of Fe
passive as that of Fe. Meanwhile, EDS analysis matrix. The introduction of Mg Si significantly
2
of corrosion products revealed that the elemental changed the cross-sectional morphology of Fe.
ratio of O/Fe became higher with the increase For Fe/0.3Mg Si, cracks were present in the
2
of Mg Si, also indicating that Fe corrosion was degradation of product layers in Figure 7B, which
2
more severe. However, local corrosion was found promoted SBF penetration. For Fe/0.6Mg Si, the
2
for Fe/1.2Mg Si, as evidenced by the circle in degradation of product layers was more porous
2
Figure 6E, which may deteriorate the mechanical and loose than that of Fe/0.3Mg Si, as shown in
2
properties during the degradation process. Local Figure 7C. For Fe/0.9Mg Si and Fe/1.2Mg Si in
2
2
corrosion for Fe/1.2Mg Si may be closely related Figure 7D,E, the degradation of product layers
2
to the presence of micropores in its microstructure. had many tiny and narrow openings exposed
To gain insight into the corrosion process of toward the outside surface. In addition, EDS
Fe/Mg Si composites in SBF, their cross-sectional analysis of Points A, B, and C in Figure 7D,E
2
morphologies after 21 days of immersion indicated that the gray region was Fe matrix and
were investigated by SEM and the elemental the black region was the degradation products
compositions were analyzed by EDS (Figure 7). containing O, Fe, and Si. The presence of these
International Journal of Bioprinting (2020)–Volume 6, Issue 1 83