
Page 88 - IJB-6-1
P. 88
Hydrolytic expansion accelerates Fe biodegradation
A B C
D E F
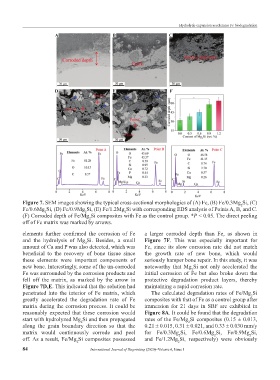
Figure 7. SEM images showing the typical cross-sectional morphologies of (A) Fe, (B) Fe/0.3Mg Si, (C)
2
Fe/0.6Mg Si, (D) Fe/0.9Mg Si, (E) Fe/1.2Mg Si with corresponding EDS analysis of Points A, B, and C.
2
2
2
(F) Corroded depth of Fe/Mg Si composites with Fe as the control group. *P < 0.05. The direct peeling
2
off of Fe matrix was marked by arrows.
elements further confirmed the corrosion of Fe a larger corroded depth than Fe, as shown in
and the hydrolysis of Mg Si. Besides, a small Figure 7F. This was especially important for
2
amount of Ca and P was also detected, which was Fe, since its slow corrosion rate did not match
beneficial to the recovery of bone tissue since the growth rate of new bone, which would
these elements were important components of seriously hamper bone repair. In this study, it was
new bone. Interestingly, some of the un-corroded noteworthy that Mg Si not only accelerated the
2
Fe was surrounded by the corrosion products and initial corrosion of Fe but also broke down the
fell off the matrix, as marked by the arrow in protective degradation product layers, thereby
Figure 7D,E. This indicated that the solution had maintaining a rapid corrosion rate.
penetrated into the interior of Fe matrix, which The calculated degradation rates of Fe/Mg Si
2
greatly accelerated the degradation rate of Fe composites with that of Fe as a control group after
matrix during the corrosion process. It could be immersion for 21 days in SBF are exhibited in
reasonably expected that these corrosion would Figure 8A. It could be found that the degradation
start with hydrolyzed Mg Si and then propagated rates of the Fe/Mg Si composites (0.15 ± 0.013,
2
2
along the grain boundary direction so that the 0.21 ± 0.015, 0.31 ± 0.021, and 0.33 ± 0.030 mm/y
matrix would continuously corrode and peel for Fe/0.3Mg Si, Fe/0.6Mg Si, Fe/0.9Mg Si,
2
2
2
off. As a result, Fe/Mg Si composites possessed and Fe/1.2Mg Si, respectively) were obviously
2
2
84 International Journal of Bioprinting (2020)–Volume 6, Issue 1