
Page 85 - IJB-6-1
P. 85
Shuai, et al.
A B
C D
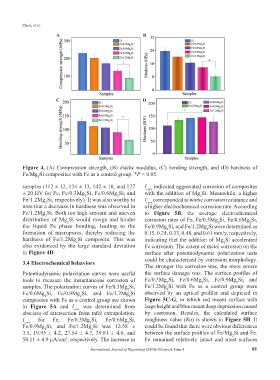
Figure 4. (A) Compression strength, (B) elastic modulus, (C) bending strength, and (D) hardness of
Fe/Mg Si composites with Fe as a control group. *P < 0.05.
2
samples (112 ± 12, 134 ± 13, 142 ± 10, and 127 I corr indicated aggravated corrosion of composites
± 20 HV for Fe, Fe/0.3Mg Si, Fe/0.6Mg Si, and with the addition of Mg Si. Meanwhile, a higher
2
2
2
Fe/1.2Mg Si, respectively). It was also worthy to I corr corresponded to worse corrosion resistance and
2
note that a decrease in hardness was observed in a higher electrochemical corrosion rate. According
Fe/1.2Mg Si. Both too high amount and uneven to Figure 5B, the average electrochemical
2
distribution of Mg Si would merge and hinder corrosion rates of Fe, Fe/0.3Mg Si, Fe/0.6Mg Si,
2
2
2
the liquid Fe phase bonding, leading to the Fe/0.9Mg Si, and Fe/1.2Mg Si were determined as
2
2
formation of micropores, thereby reducing the 0.15, 0.24, 0.33, 0.48, and 0.61 mm/y, respectively,
hardness of Fe/1.2Mg Si composite. This was indicating that the addition of Mg Si accelerated
2
2
also evidenced by the large standard deviation Fe corrosion. The extent of metal corrosion on the
in Figure 4D. surface after potentiodynamic polarization tests
could be characterized by corrosion morphology.
3.4 Electrochemical behaviors
The stronger the corrosion was, the more severe
Potentiodynamic polarization curves were useful the surface damage was. The surface profiles of
tools to measure the instantaneous corrosion of Fe/0.3Mg Si, Fe/0.6Mg Si, Fe/0.9Mg Si, and
2
2
2
samples. The polarization curves of Fe/0.3Mg Si, Fe/1.2Mg Si with Fe as a control group were
2
2
Fe/0.6Mg Si, Fe/0.9Mg Si, and Fe/1.2Mg Si observed by an optical profiler and depicted in
2
2
2
composites with Fe as a control group are shown Figure 5C-G, in which red meant surface with
in Figure 5A and I corr was determined from large height and blue meant deep depression caused
abscissa of intersection from tafel extrapolation. by corrosion. Besides, the calculated surface
I corr for Fe, Fe/0.3Mg Si, Fe/0.6Mg Si, roughness value (Ra) is shown in Figure 5H. It
2
2
Fe/0.9Mg Si, and Fe/1.2Mg Si was 12.58 ± could be found that there were obvious differences
2
2
3.5, 19.95 ± 4.2, 27.54 ± 4.7, 39.81 ± 4.6, and between the surface profiles of Fe/Mg Si and Fe.
2
50.11 ± 4.9 μA/cm , respectively. The increase in Fe remained relatively intact and most surfaces
2
International Journal of Bioprinting (2020)–Volume 6, Issue 1 81