
Page 89 - IJB-6-1
P. 89
Shuai, et al.
A B
C D
F E
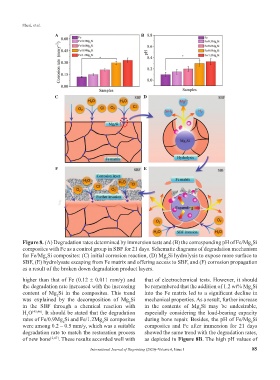
Figure 8. (A) Degradation rates determined by immersion tests and (B) the corresponding pH of Fe/Mg Si
2
composites with Fe as a control group in SBF for 21 days. Schematic diagrams of degradation mechanism
for Fe/Mg Si composites: (C) initial corrosion reaction, (D) Mg Si hydrolysis to expose more surface to
2
2
SBF, (E) hydrolysate escaping from Fe matrix and offering access to SBF, and (F) corrosion propagation
as a result of the broken down degradation product layers.
higher than that of Fe (0.12 ± 0.011 mm/y) and that of electrochemical tests. However, it should
the degradation rate increased with the increasing be remembered that the addition of 1.2 wt% Mg Si
2
content of Mg Si in the composites. This trend into the Fe matrix led to a significant decline in
2
was explained by the decomposition of Mg Si mechanical properties. As a result, further increase
2
in the SBF through a chemical reaction with in the contents of Mg Si may be undesirable,
2
H O [45,46] . It should be stated that the degradation especially considering the load-bearing capacity
2
rates of Fe/0.9Mg Si and Fe/1.2Mg Si composites during bone repair. Besides, the pH of Fe/Mg Si
2
2
2
were among 0.2 – 0.5 mm/y, which was a suitable composites and Fe after immersion for 21 days
degradation rate to match the restoration process showed the same trend with the degradation rates,
of new bone [2,47] . These results accorded well with as depicted in Figure 8B. The high pH values of
International Journal of Bioprinting (2020)–Volume 6, Issue 1 85