Page 86 - IJB-6-1
P. 86

Hydrolytic expansion accelerates Fe biodegradation
              A                                            B


              C                              D                               E


             F                               G                               H


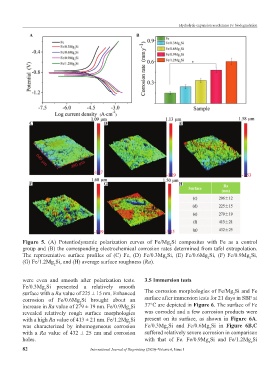
           Figure 5.  (A) Potentiodynamic  polarization  curves of Fe/Mg Si composites  with Fe as a control
                                                                         2
           group and (B) the corresponding electrochemical corrosion rates determined from tafel extrapolation.
           The  representative  surface  profiles  of  (C)  Fe,  (D)  Fe/0.3Mg Si,  (E)  Fe/0.6Mg Si,  (F) Fe/0.9Mg Si,
                                                                                                           2
                                                                       2
                                                                                         2
           (G) Fe/1.2Mg Si, and (H) average surface roughness (Ra).
                        2
           were even and smooth after  polarization  tests.    3.5 Immersion tests
           Fe/0.3Mg Si presented a relatively  smooth
                    2
           surface with a Ra value of 225 ± 15 nm. Enhanced    The corrosion morphologies of Fe/Mg Si and Fe
                                                                                                    2
           corrosion of Fe/0.6Mg Si brought about  an          surface after immersion tests for 21 days in SBF at
                                   2
           increase in Ra value of 279 ± 19 nm. Fe/0.9Mg Si    37°C are depicted in Figure 6. The surface of Fe
                                                        2
           revealed  relatively  rough  surface  morphologies   was corroded and a few corrosion products were
           with a high Ra value of 413 ± 21 nm. Fe/1.2Mg Si    present on its surface, as shown in  Figure 6A.
                                                        2
           was characterized  by inhomogeneous  corrosion      Fe/0.3Mg Si  and  Fe/0.6Mg Si  in  Figure  6B,C
                                                                                          2
                                                                        2
           with a  Ra value of 432 ± 25  nm and corrosion      suffered relatively severe corrosion in comparison
           holes.                                              with that of Fe. Fe/0.9Mg Si and Fe/1.2Mg Si
                                                                                          2                 2
           82                          International Journal of Bioprinting (2020)–Volume 6, Issue 1
   81   82   83   84   85   86   87   88   89   90   91