
Page 83 - IJB-6-1
P. 83
Shuai, et al.
A B C D
E F G H
I J K
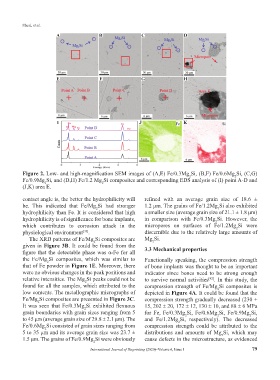
Figure 2. Low- and high-magnification SEM images of (A,E) Fe/0.3Mg Si, (B,F) Fe/0.6Mg Si, (C,G)
2
2
Fe/0.9Mg Si, and (D,H) Fe/1.2 Mg Si composites and corresponding EDS analysis of (I) point A-D and
2
2
(J,K) area E.
contact angle is, the better the hydrophilicity will refined with an average grain size of 18.6 ±
be. This indicated that Fe/Mg Si had stronger 1.2 μm. The grains of Fe/1.2Mg Si also exhibited
2
2
hydrophilicity than Fe. It is considered that high a smaller size (average grain size of 21.1 ± 1.8 μm)
hydrophilicity is of significance for bone implants, in comparison with Fe/0.3Mg Si. However, the
2
which contributes to corrosion attack in the micropores on surfaces of Fe/1.2Mg Si were
2
physiological environment . discernible due to the relatively large amounts of
[38]
The XRD patterns of Fe/Mg Si composites are Mg Si.
2
2
given in Figure 3B. It could be found from the 3.3 Mechanical properties
figure that the detectable phase was α-Fe for all
the Fe/Mg Si composites, which was similar to Functionally speaking, the compression strength
2
that of Fe powder in Figure 1E. Moreover, there of bone implants was thought to be an important
were no obvious changes in the peak positions and indicator since bones need to be strong enough
relative intensities. The Mg Si peaks could not be to survive normal activities . In this study, the
[42]
2
found for all the samples, which attributed to the compression strength of Fe/Mg Si composites is
2
low contents. The metallographic micrographs of depicted in Figure 4A. It could be found that the
Fe/Mg Si composites are presented in Figure 3C. compression strength gradually decreased (230 ±
2
It was seen that Fe/0.3Mg Si exhibited flexuous 15, 202 ± 20, 172 ± 12, 130 ± 10, and 88 ± 6 MPa
2
grain boundaries with grain sizes ranging from 5 for Fe, Fe/0.3Mg Si, Fe/0.6Mg Si, Fe/0.9Mg Si,
2
2
2
to 45 μm (average grain size of 29.8 ± 2.1 μm). The and Fe/1.2Mg Si, respectively). The decreased
2
Fe/0.6Mg Si consisted of grain sizes ranging from compression strength could be attributed to the
2
5 to 35 μm and its average grain size was 23.7 ± distributions and amounts of Mg Si, which may
2
1.5 μm. The grains of Fe/0.9Mg Si were obviously cause defects in the microstructure, as evidenced
2
International Journal of Bioprinting (2020)–Volume 6, Issue 1 79