
Page 103 - IJB-6-3
P. 103
Bozo, et al.
effect between particles. The crystallization Compressive strength of 3D printed samples
of TCP to DCPD was finished after 7 days is presented in Figure 2F and G. The strength
(Figure 2A and B). 3D printed samples with of the investigated samples increased from 1.5
DCPD phase composition were transformed into to 4.5 MPa up to about 4.3 – 7.9 MPa after post
OCP of soaking in sodium acetate, according to treatment.
XRD, FTIR and SEM (Figure 2A, B and D). XRD 3D printed gene-activated implants
data of the OCP showed certain amounts of OCP were produced using the supercoiled naked
phase with (100) reflection at 2θ=4.9°. However, plasmid DNA encoding VEGFA gene. Based
the post-treated samples contained some quantity on the SEM study, we identified some round
of unreacted DCPD. High intensity of diffraction structures on the surface of gene-activated bone
peaks indicates high crystallinity of OCP materials substitutes, which corresponded to plasmid DNA
(Figure 2A). FTIR data of the OCP samples are macromolecules (Figure 3A and B). Fluorimetry
presented on Figure 2B and are in agreement with results demonstrated an average concentration
those previously reported in Fowler et al. . The of 3D scaffold-bound plasmid DNA to be
[15]
OH bending modes originating from the HPO 52.74 ± 1.76 ng/mg.
4
groups of OCP were observed at 1295 cm . P–O A luminescent signal with intensity
-1
in HPO and PO groups were assigned at 1118, corresponding to the production level of luciferase
4
4
1029, and 960 cm . The P–OH stretching mode encoded by pDNA-Luc was detected only locally
−1
of HPO groups was at 870 cm . OCP plates were – within a zone of localization of a pDNA-Luc
−1
4
needle-like 2 – 5 μm long and 1 – 2 μm wide solution or 3D printed gene-activated implants
(Figure 2D). containing pDNA-Luc. No signal was detected in
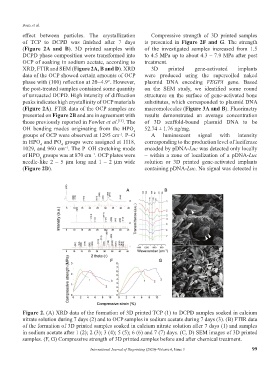
Figure 2. (A) XRD data of the formation of 3D printed TCP (1) to DCPD samples soaked in calcium
nitrate solution during 7 days (2) and to OCP samples in sodium acetate during 7 days (3). (B) FTIR data
of the formation of 3D printed samples soaked in calcium nitrate solution after 7 days (1) and samples
in sodium acetate after 1 (2); 2 (3); 3 (4); 5 (5); 6 (6) and 7 (7) days. (C, D) SEM images of 3D printed
samples. (F, G) Compressive strength of 3D printed samples before and after chemical treatment.
International Journal of Bioprinting (2020)–Volume 6, Issue 3 99