
Page 107 - IJB-6-3
P. 107
Bozo, et al.
A B C D
E
F
G
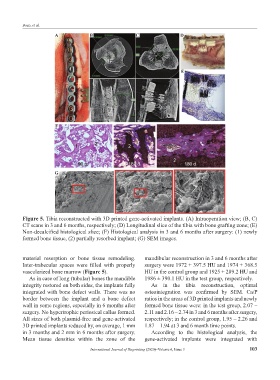
Figure 5. Tibia reconstructed with 3D printed gene-activated implants. (A) Intraoperation view; (B, C)
CT scans in 3 and 6 months, respectively; (D) Longitudinal slice of the tibia with bone grafting zone; (E)
Non-decalcified histological slice; (F) Histological analysis in 3 and 6 months after surgery: (1) newly
formed bone tissue, (2) partially resorbed implant; (G) SEM images.
material resorption or bone tissue remodeling. mandibular reconstruction in 3 and 6 months after
Inter-trabecular spaces were filled with properly surgery were 1972 ± 397.5 HU and 1974 ± 368.5
vascularized bone marrow (Figure 5). HU in the control group and 1925 ± 289.2 HU and
As in case of long (tubular) bones the mandible 1986 ± 390.1 HU in the test group, respectively.
integrity restored on both sides, the implants fully As in the tibia reconstruction, optimal
integrated with bone defect walls. There was no osteointegration was confirmed by SEM. Ca/P
border between the implant and a bone defect ratios in the areas of 3D printed implants and newly
wall in some regions, especially in 6 months after formed bone tissue were: in the test group, 2.07 –
surgery. No hypertrophic periosteal callus formed. 2.11 and 2.16 – 2.74 in 3 and 6 months after surgery,
All sizes of both plasmid-free and gene-activated respectively; in the control group, 1.95 – 2.26 and
3D printed implants reduced by, on average, 1 mm 1.87 – 1.94 at 3 and 6 month time points.
in 3 months and 2 mm in 6 months after surgery. According to the histological analysis, the
Mean tissue densities within the zone of the gene-activated implants were integrated with
International Journal of Bioprinting (2020)–Volume 6, Issue 3 103