
Page 104 - IJB-6-3
P. 104
3D printed gene-activated implants for bone regeneration
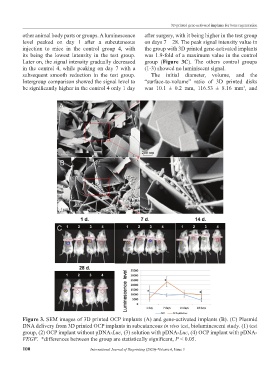
other animal body parts or groups. A luminescence after surgery, with it being higher in the test group
level peaked on day 1 after a subcutaneous on days 7 – 28. The peak signal intensity value in
injection to mice in the control group 4, with the group with 3D printed gene-activated implants
its being the lowest intensity in the test group. was 1.9-fold of a maximum value in the control
Later on, the signal intensity gradually decreased group (Figure 3C). The others control groups
in the control 4, while peaking on day 7 with a (1-3) showed no luminiscent signal.
subsequent smooth reduction in the test group. The initial diameter, volume, and the
Intergroup comparison showed the signal level to “surface-to-volume” ratio of 3D printed disks
be significantly higher in the control 4 only 1 day was 10.1 ± 0.2 mm, 116.53 ± 8.16 mm , and
3
Figure 3. SEM images of 3D printed OCP implants (A) and gene-activated implants (B). (C) Plasmid
DNA delivery from 3D printed OCP implants in subcutaneous in vivo test, bioluminescent study. (1) test
group, (2) OCP implant without pDNA-Luc, (3) solution with pDNA-Luc, (4) OCP implant with pDNA-
VEGF. *differences between the group are statistically significant, P < 0.05.
100 International Journal of Bioprinting (2020)–Volume 6, Issue 3