
Page 115 - IJB-6-4
P. 115
Matsugaki, et al.
A
B
C D
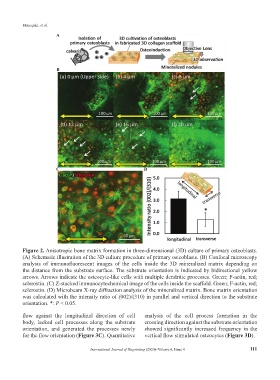
Figure 2. Anisotropic bone matrix formation in three-dimensional (3D) culture of primary osteoblasts.
(A) Schematic illustration of the 3D culture procedure of primary osteoblasts. (B) Confocal microscopy
analysis of immunofluorescent images of the cells inside the 3D mineralized matrix depending on
the distance from the substrate surface. The substrate orientation is indicated by bidirectional yellow
arrows. Arrows indicate the osteocyte-like cells with multiple dendritic processes. Green; F-actin, red;
sclerostin. (C) Z-stacked immunocytochemical image of the cells inside the scaffold. Green; F-actin, red;
sclerostin. (D) Microbeam X-ray diffraction analysis of the mineralized matrix. Bone matrix orientation
was calculated with the intensity ratio of (002)/(310) in parallel and vertical direction to the substrate
orientation. *: P < 0.05.
flow against the longitudinal direction of cell analysis of the cell process formation in the
body, lacked cell processes along the substrate crossing direction against the substrate orientation
orientation, and generated the processes newly showed significantly increased frequency in the
for the flow orientation (Figure 3C). Quantitative vertical flow stimulated osteocytes (Figure 3D).
International Journal of Bioprinting (2020)–Volume 6, Issue 4 111