
Page 127 - IJB-6-4
P. 127
Tan, et al.
A
B
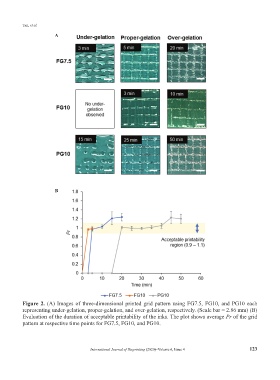
Figure 2. (A) Images of three-dimensional printed grid pattern using FG7.5, FG10, and PG10 each
representing under-gelation, proper-gelation, and over-gelation, respectively. (Scale bar = 2.86 mm) (B)
Evaluation of the duration of acceptable printability of the inks. The plot shows average Pr of the grid
pattern at respective time points for FG7.5, FG10, and PG10.
International Journal of Bioprinting (2020)–Volume 6, Issue 4 123