
Page 128 - IJB-6-4
P. 128
Preheating of gelatin improves its printability with transglutaminase
(or discontinuity) could have occurred at specific The time point for the gelation allows us to
points of the printed lattice. This error may not approximate when the ink is printable with
be critical due to the sufficiently large 3D printed acceptable morphology and mechanical stability.
lattice structure. We chose small square grids (n We performed a time-sweep experiment to identify
= 5) to calculate the average of Pr values at the the gelation time of FG7.5, FG10, and PG10. The
respective time points. The values of Pr for FG7.5, experiment was conducted at 40°C, which was
FG10, and PG10 were plotted with respect to time consistent with the printing temperature of the
to predict the duration for acceptable printability inks. This temperature ensured that the gelation
(0.9 < Pr < 1.1). Assuming linear changes in Pr was solely due to enzymatic crosslinking but not
between the data points, we estimated the duration due to the temperature at which the experiment
of time that offered acceptable printability; the was performed. The time point where the storage
duration was the longest for PG10 (~20 min), modulus matched with the loss modulus was
which was higher than for FG7.5 (~5 min) and recorded as the gelation time. Note that the
FG10 (~2 min) (Figure 2B). reported values in this section include an extra 2.5
2.4 Effect of PG ink on gelation time min (150 s) in addition to the time recorded by
the rheometer (shown in the graphs in Figure 3).
The gelation of the ink triggered the phase change This extra time accounts for the time required to
of the ink from liquid to gel due to enzymatic prepare the samples (i.e., mixing the gelatin with
crosslinking. The viscosity of the ink became TG and loading it into the instrument). After the
effectively infinite when the gelation completed . completion of the gelation, both storage and loss
[38]
A B
C D
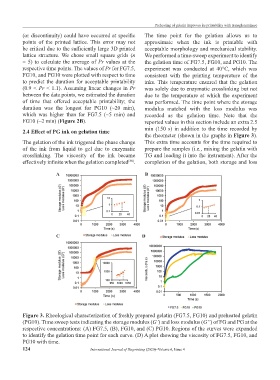
Figure 3. Rheological characterization of freshly prepared gelatin (FG7.5, FG10) and preheated gelatin
(PG10). Time sweep tests indicating the storage modulus (G’) and loss modulus (G”) of FG and PG at the
respective concentrations: (A) FG7.5, (B), FG10, and (C) PG10. Regions of the curves were expanded
to identify the gelation time point for each curve. (D) A plot showing the viscosity of FG7.5, FG10, and
PG10 with time.
124 International Journal of Bioprinting (2020)–Volume 6, Issue 4