Page 43 - IJB-6-4
        P. 43
     Celik, et al.
                                                                 where  x  represents  the  functions  value
                       Feature   cost*  9.22  6.8  3.3  -  7.95  32.48  1  100  weighting;
                                                                           i
                                                                 y represents functions cost weighting;
                                                                   i
                                               0.12315          a    xy   represents the regression parameter.
                                                                       ii
                       F10                        12.315              x i 2
                                0.8
                             1.2
                                      0.5
                                   0.5
                                         1
                                            4
                                                                     The estimator S  is  determined  with  the
                       F9    0.75  0.3  0.2  0.7  0.75  2.7  0.08312  8.312  •      smallest squares method:
                                                                                     i
                       F8    1  0.54  -  0.46  1  3  0.09236  9.236          S    y  ax  g  i  2  min�  (3)
                                                               •   The dispersion S’ must be as close as possible
                       F7    0.72  0.4  0.2  0.4  0.8  2.52  0.07758  7.758  to zero value to validate the solution.
                                                                             S     2gg  i 2  x y        (4)
                                                                                       a x  2g
                                                                              '
                                                                                                i i
                       F6    0.53  0.46  -  0.41  0.5  1.9  0.05849  5.849  •   The angle  of the regression line:
                       F5    1.1  -  1.6  0.3  0.3  3.3  0.1016  10.16       α =  arctg   ( ) a  180        (5)
                                                                                         π
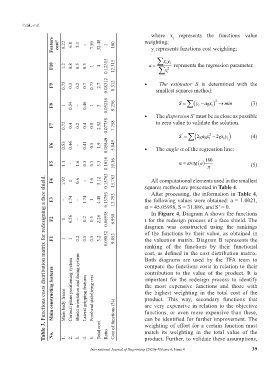
                    Table 3. Functions costs distribution matrix for redesigning a face shield.
                                                                 All computational elements used in the smallest
                       F4    1.92  1  0.6  -  1.6  5.12  0.15763  15.763  squares method are presented in Table 4.
                                                                 After processing, the information in Table 4,
                       F3    -  1.74  -  1.74  1  4.48  0.13793  13.793  the following values were obtained: a = 1.0021,
                                                               α = 45.05998, S = 31.886, and S’ = 0.
                                                                 In Figure 4, Diagram A shows the functions
                       F2    1  0.56  -  0.2  0.5  2.26  0.06958  6.958  t for the redesign process of a face shield. The
                                                               diagram  was  constructed  using  the  rankings
                                               0.09852  9.852  of  the  functions  by  their  value,  as  obtained  in
                                      0.5
                                         0.5
                                            3.2
                                   0.2
                       F1                                      the valuation matrix. Diagram B represents the
                             1
                                1
                                                               ranking  of  the  functions  by  their  functional
                                                               cost, as defined in the cost distribution matrix.
                                                               Both  diagrams  are  used  by  the  TFA  team  to
                                                               compare the functions costs in relation to their
                       Main constructing features  Main body frame Coronal plane positioning system Shield orientation and fixing system  Lateral gripping features  Forehead stabilizing rest  important for the redesign process to identify
                                                               contribution  to  the  value  of  the  product.  It  is
                                                               the  most  expensive  functions  and  those  with
                                                               the  highest  weighting  in  the  total  cost  of  the
                                                               product.  This  way,  secondary  functions  that
                                                               are  very  expensive  in  relation  to  the  objective
                                                               functions,  or  even  more  expensive  than  these,
                                            Total cost  Cost of functions (%)  can be identified for further improvement. The
                                                               weighting of effort for a certain function must
                                                               match  its  weighting  in  the  total  value  of  the
                       No.   1.  2.  3.  4.  5.  Ratio         product. Further, to validate these assumptions,
                                       International Journal of Bioprinting (2020)–Volume 6, Issue 4        39
     	
