
Page 44 - IJB-6-4
P. 44
Design and AM of a medical face shield
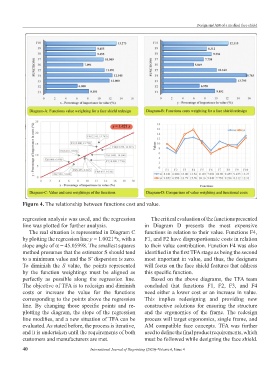
Figure 4. The relationship between functions cost and value.
regression analysis was used, and the regression The critical evaluation of the functions presented
line was plotted for further analysis. in Diagram D presents the most expensive
The real situation is represented in Diagram C functions in relation to their value. Functions F4,
by plotting the regression line y = 1.0021*x, with a F1, and F2 have disproportionate costs in relation
slope angle of α = 45.05998. The smallest squares to their value contribution. Function F4 was also
method presumes that the estimator S should tend identified in the first TFA stage as being the second
to a minimum value and the S’ dispersion is zero. most important in value, and thus, the designers
To diminish the S value, the points represented will focus on the face shield features that address
by the function weightings must be aligned as this specific function.
perfectly as possible along the regression line. Based on the above diagrams, the TFA team
The objective of TFA is to redesign and diminish concluded that functions F1, F2, F3, and F4
costs or increase the value for the functions need either a lower cost or an increase in value.
corresponding to the points above the regression This implies redesigning and providing new
line. By changing those specific points and re- constructive solutions for ensuring the structure
plotting the diagram, the slope of the regression and the ergonomics of the frame. The redesign
line modifies, and a new situation of TFA can be process will target ergonomics, single frame, and
evaluated. As stated before, the process is iterative, AM compatible face concepts. TFA was further
and it is undertaken until the requirements of both used to define the final product requirements, which
customers and manufacturers are met. must be followed while designing the face shield.
40 International Journal of Bioprinting (2020)–Volume 6, Issue 4