
Page 190 - IJB-10-6
P. 190
International Journal of Bioprinting 3D-printed EVs for nasal septal defects
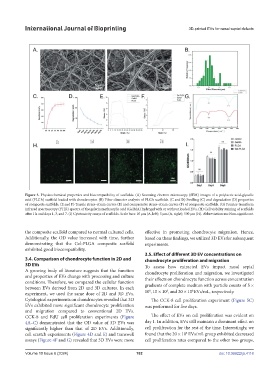
Figure 3. Physicochemical properties and biocompatibility of scaffolds. (A) Scanning electron microscopy (SEM) images of a polylactic acid-glycolic
acid (PLGA) scaffold loaded with chondrocytes. (B) Fiber diameter analysis of PLGA scaffolds. (C and D) Swelling (C) and degradation (D) properties
of composite scaffolds. (E and F) Tensile stress–strain curves (E) and compressive stress–strain curves (F) of composite scaffolds. (G) Fourier-transform
infrared spectroscopy (FTIR) spectra of the gelatin methacrylic acid (GelMA) hydrogel with or without loaded EVs. (H) Cell viability staining of scaffolds
after 1 h and days 1, 3, and 7. (I) Cytotoxicity assays of scaffolds. Scale bars: 10 μm (A, left); 5 μm (A, right); 500 μm (H). Abbreviation: ns: Non-significant.
the composite scaffold compared to normal cultured cells. effective in promoting chondrocyte migration. Hence,
Additionally, the OD value increased with time, further based on these findings, we utilized 3D EVs for subsequent
demonstrating that the Gel-PLGA composite scaffold experiments.
exhibited good biocompatibility.
3.5. Effect of different 3D EV concentrations on
3.4. Comparison of chondrocyte function in 2D and chondrocyte proliferation and migration
3D EVs To assess how extracted EVs impact nasal septal
A growing body of literature suggests that the function chondrocyte proliferation and migration, we investigated
and properties of EVs change with processing and culture their effects on chondrocyte function across concentration
conditions. Therefore, we compared the cellular function
between EVs derived from 2D and 3D cultures. In each gradients of complete medium with particle counts of 5 ×
8
8
8
experiment, we used the same dose of 2D and 3D EVs. 10 , 10 × 10 , and 20 × 10 EVs/mL, respectively.
Cytological experiments on chondrocytes revealed that 3D The CCK-8 cell proliferation experiment (Figure 5C)
EVs exhibited more significant chondrocyte proliferation was performed for five days.
and migration compared to conventional 2D EVs.
CCK-8 and EdU cell proliferation experiments (Figure The effect of EVs on cell proliferation was evident on
4A–C) demonstrated that the OD value of 3D EVs was day 1. In addition, EVs still maintain a dominant effect on
significantly higher than that of 2D EVs. Additionally, cell proliferation for the rest of the time. Interestingly, we
8
cell scratch experiments (Figure 4D and E) and transwell found that the 20 × 10 EVs/mL group exhibited decreased
assays (Figure 4F and G) revealed that 3D EVs were more cell proliferation rates compared to the other two groups,
Volume 10 Issue 6 (2024) 182 doi: 10.36922/ijb.4118