
Page 193 - IJB-10-6
P. 193
International Journal of Bioprinting 3D-printed EVs for nasal septal defects
did not enhance the expression of Col II and displayed relevant matrix is inhibited in an environment with high
similar fluorescence intensity to the control group. To concentrations of EVs.
further explore this phenomenon, we conducted qPCR 3.7. EV composite scaffolds repair cartilage defects
and western blotting for genes related to chondrogenesis in vivo
(Figure 6F). ACAN (Figure 6D and G) is also an important A 5 × 5 mm defect was created in the nasal septum of
component of the cartilage extracellular matrix, while rabbits; samples and tissues were examined at 6 and 12
SOX9 (Figure 6E and H) primarily regulates chondrocyte weeks post-stent implantation. We previously tested the
formation. The results of qPCR and western blotting swelling properties of the composite stent, which rapidly
8
indicated that the 5 × 10 EVs/mL group upregulated these absorbs blood and body fluids around the tissue upon
three genes, but was not statistically different relative to implantation, causing it to swell. There were no adverse
the control group. Interestingly, the three chondrogenesis reactions in all experimental animal groups after surgery,
genes in the 10 × 10 EVs/mL group were significantly with good survival rates.
8
upregulated relative to the other groups, corroborating We established a sham group, a control group, a
our immunofluorescence results. In contrast, the 20 × 10 Gel-PLGA scaffold group, and an EV-loaded composite
8
EVs/mL group displayed downregulated gene expressions scaffold group. The staining results of the sections are
compared to the other two EV groups, particularly for presented in Figures 7–9. H&E (Figure 7D) and toluidine
Col II (Figure 6C and I). Based on the above results, we blue (Figure 8A) staining revealed that the scaffold
speculate that the ability of chondrocytes to secrete the group exhibited some healing compared to the control
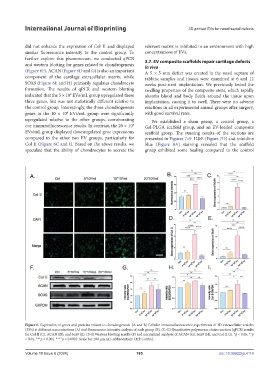
Figure 6. Expression of genes and proteins related to chondrogenesis. (A and B) Cellular immunofluorescence experiments of 3D extracellular vesicles
(EVs) at different concentrations (A) and fluorescence intensity analysis of each group (B). (C–E) Quantitative polymerase chain reaction (qPCR) results
for Col II (C), ACAN (D), and Sox9 (E). (F–I) Western blotting results (F) and normalized analyses of ACAN (G), Sox9 (H), and Col II (I). *p < 0.05, **p
< 0.01, ***p < 0.001, ****p < 0.0001. Scale bar:100 μm (A). Abbreviation: Ctrl: Control.
Volume 10 Issue 6 (2024) 185 doi: 10.36922/ijb.4118