
Page 261 - IJB-10-6
P. 261
International Journal of Bioprinting 3D-printed contractive pennate muscle
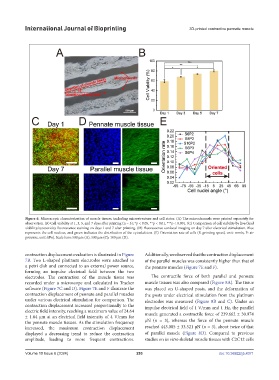
Figure 6. Microscopic characterization of muscle tissues, including microstructure and cell status. (A) The microchannels were printed separately for
observation. (B) Cell viability at 1, 3, 5, and 7 days after printing (n = 3); *p < 0.05, **p < 0.01, ***p < 0.001. (C) Comparison of cell viability by live/dead
viability/cytotoxicity fluorescence staining on days 1 and 7 after printing. (D) Fluorescence confocal imaging on day 7 after electrical stimulation. Blue
represents the cell nucleus, and green indicates the distribution of the cytoskeleton. (E) Orientation rate of cells (S: printing speed, unit: mm/s; P: air
pressure, unit: kPa). Scale bars: 500 µm (A), 500 µm (C); 100 µm (D).
contraction displacement evaluation is illustrated in Figure Additionally, we observed that the contraction displacement
7B. Two L-shaped platinum electrodes were attached to of the parallel muscles was consistently higher than that of
a petri dish and connected to an external power source, the pennate muscles (Figure 7E and F).
forming an impulse electrical field between the two
electrodes. The contraction of the muscle tissue was The contractile force of both parallel and pennate
recorded under a microscope and calculated in Tracker muscle tissues was also compared (Figure 8A). The tissue
software (Figure 7C and D). Figure 7E and F illustrate the was placed on U-shaped posts, and the deformation of
contraction displacement of pennate and parallel muscles the posts under electrical stimulation from the platinum
under various electrical stimulation for comparison. The electrodes was measured (Figure 8B and C). Under an
contraction displacement increased proportionally to the impulse electrical field of 1 V/mm and 1 Hz, the parallel
electric field intensity, reaching a maximum value of 24.64
± 1.64 μm at an electrical field intensity of 4 V/mm for muscle generated a contractile force of 239.662 ± 30.974
the pennate muscle tissues. As the stimulation frequency μN (n = 3), whereas the force of the pennate muscle
increased, the maximum contraction displacement reached 443.085 ± 33.521 μN (n = 3), about twice of that
displayed a decreasing trend to reduce the contraction of parallel muscle (Figure 8D). Compared to previous
amplitude, leading to more frequent contractions. studies on in vitro skeletal muscle tissues with C2C12 cells
Volume 10 Issue 6 (2024) 253 doi: 10.36922/ijb.4371