
Page 467 - IJB-10-6
P. 467
International Journal of Bioprinting Stress prediction in 3D-printed scaffolds
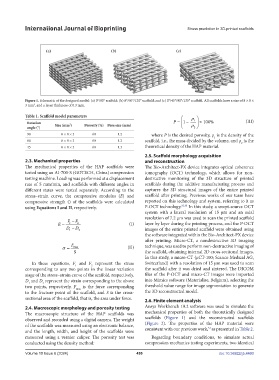
Figure 1. Schematic of the designed model: (a) 0°/90° scaffold; (b) 0°/60°/120° scaffold; and (c) 0°/45°/90°/135° scaffold. All scaffolds have a size of 8 × 8 ×
3 mm , and a layer thickness of 0.3 mm.
3
Table 1. Scaffold model parameters ρ
Rotation Size (mm ) Porosity (%) Pore size (mm) P = 1 − ρ 1 × 100% (III)
3
angle (°) 2
90 8 × 8 × 3 60 1.2 where P is the desired porosity, ρ is the density of the
1
60 8 × 8 × 3 60 1.2 scaffold, i.e., the mass divided by the volume, and ρ is the
2
45 8 × 8 × 3 60 1.3 theoretical density of the HAP material.
2.5. Scaffold morphology acquisition
2.3. Mechanical properties and reconstruction
The mechanical properties of the HAP scaffolds were The Bio-Architect-PX device integrates optical coherence
tested using an AI-700-S (GOTECH, China) compression tomography (OCT) technology, which allows for non-
testing machine. Loading was performed at a displacement destructive monitoring of the 3D structure of printed
rate of 5 mm/min, and scaffolds with different angles in scaffolds during the additive manufacturing process and
different states were tested separately. According to the captures the 3D structural images of the entire printed
stress–strain curve, the compressive modulus (E) and scaffold after printing. Previous works of our team have
compressive strength () of the scaffolds were calculated reported on this technology and system, referring to it as
using Equations I and II, respectively. P-OCT technology. 32,33 In this study, a swept-source OCT
system with a lateral resolution of 15 μm and an axial
resolution of 7.2 μm was used to scan the printed scaffold
F − F
E = 1 2 (I) layer by layer during the printing process, and the P-OCT
D − D 2 images of the entire printed scaffold were obtained using
1
the software integrated within the Bio-Architect-PX device
after printing. Micro-CT, a nondestructive 3D imaging
σ = F max (II) technique, was used to perform non-destructive imaging of
S the scaffold, obtaining internal 2D cross-sectional images.
In this study, a micro-CT (μCT-100; Scanco Medical AG,
In these equations, F and F represent the stress Switcerland) with a resolution of 15 μm was used to scan
1
2
corresponding to any two points in the linear variation the scaffold after it was dried and sintered. The DICOM
stage of the stress–strain curve of the scaffold, respectively. files of the P-OCT and micro-CT images were imported
D and D represent the strain corresponding to the above into Mimics software (Materialise, Belgium), selecting the
1
2
two points, respectively. F max is the force corresponding threshold value range for image segmentation to generate
to the fracture point of the scaffold, and S is the cross- the 3D reconstructed model.
sectional area of the scaffold, that is, the area under force. 2.6. Finite element analysis
2.4. Macroscopic morphology and porosity testing Ansys Workbench 19.2 software was used to simulate the
The macroscopic structure of the HAP scaffolds was mechanical properties of both the theoretically designed
observed and recorded using a digital camera. The weight scaffolds (Figure 1) and the reconstructed scaffolds
of the scaffolds was measured using an electronic balance, (Figure 2). The properties of the HAP material were
34
and the length, width, and height of the scaffolds were consistent with our previous work, as presented in Table 2.
measured using a vernier caliper. The porosity test was Regarding boundary conditions, to simulate actual
conducted using the density method: compression mechanics testing experiments, two identical
Volume 10 Issue 6 (2024) 459 doi: 10.36922/ijb.4460