
Page 475 - IJB-10-6
P. 475
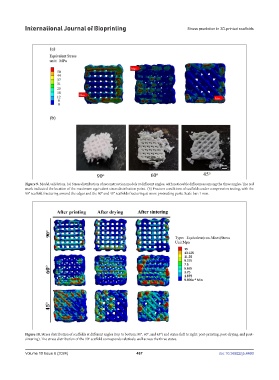
International Journal of Bioprinting                                 Stress prediction in 3D-printed scaffolds


            Figure 9. Model validation. (a) Stress distribution of reconstruction models at different angles, with noticeable differences among the three angles. The red
            mark indicated the location of the maximum equivalent stress distribution point.  (b) Fracture conditions of scaffolds under compression testing, with the
            90° scaffold fracturing around the edges and the 60° and 45° scaffolds fracturing at more protruding parts. Scale bar: 1 mm.


            Figure 10. Stress distribution of scaffolds at different angles (top to bottom: 90°, 60°, and 45°) and states (left to right: post-printing, post-drying, and post-
            sintering). The stress distribution of the 90° scaffold corresponds relatively well across the three states.


            Volume 10 Issue 6 (2024)                       467                                doi: 10.36922/ijb.4460