
Page 100 - IJB-7-1
P. 100
3D Printing of Ceramic Dental Prostheses
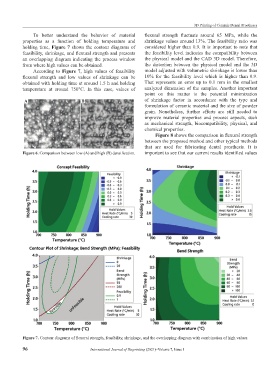
To better understand the behavior of material flexural strength fluctuate around 65 MPa, while the
properties as a function of holding temperature and shrinkage values around 13%. The feasibility ratio was
holding time, Figure 7 shows the contour diagrams of considered higher than 0.9. It is important to note that
feasibility, shrinkage, and flexural strength and presents the feasibility level indicates the compatibility between
an overlapping diagram indicating the process window the physical model and the CAD 3D model. Therefore,
from where high values can be obtained. the distortion between the physical model and the 3D
According to Figure 7, high values of feasibility model adjusted with volumetric shrinkage is lower than
flexural strength and low values of shrinkage can be 10% for the feasibility level which is higher than 0.9.
obtained with holding time at around 1.5 h and holding That represents an error up to 0.1 mm in the smallest
temperature at around 750°C. In this case, values of analyzed dimension of the samples. Another important
point on this matter is the potential minimization
A B of shrinkage factor in accordance with the type and
formulation of ceramic material and the size of powder
grain. Nonetheless, further efforts are still needed to
improve material properties and process aspects, such
as mechanical strength, biocompatibility, physical, and
chemical properties.
Figure 8 shows the comparison in flexural strength
between the proposed method and other typical methods
that are used for fabricating dental prosthesis. It is
Figure 6. Comparison between low (A) and high (B) densification. important to see that our current results identified values
Figure 7. Contour diagrams of flexural strength, feasibility, shrinkage, and the overlapping diagram with combination of high values.
96 International Journal of Bioprinting (2021)–Volume 7, Issue 1