
Page 110 - IJB-7-2
P. 110
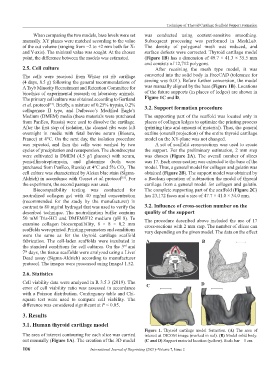
Technique of Thyroid Cartilage Scaffold Support Formation
               When comparing the two models, base levels were set   was conducted using context-sensitive  smoothing.
           manually. XY planes were matched according to the value   Subsequent  processing  was performed  in  MeshLab.
           of the cut volume (ranging from −2 to +2 mm both for X-   The density of polygonal mesh was reduced, and
           and Y-axis). The minimal value was sought. At the chosen   surface defects were corrected. Thyroid cartilage model
           point, the difference between the models was estimated.  (Figure 1B) has a dimension of 49.7 × 41.3 × 35.5 mm
                                                               and consists of 12,712 polygons.
           2.5. Cell culture                                       After receiving  the mesh type model, it was
           The cells were received from  Wistar rat rib cartilage   converted into the solid body in FreeCAD (tolerance for
           (4 days, 8.5 g) following the general recommendations of   sewing was 0.01). Before further conversion, the model
           A Tsyb Minority Recruitment and Retention Committee for   was manually aligned by the base (Figure 1B). Locations
           bioethics of experimental research on laboratory animals.   of the future supports (in places of ledges) are shown in
           The primary cell culture was obtained according to Gartland   Figure 1C and D.
           et al. protocol . Briefly, a mixture of 0.25% trypsin, 0.2%   3.2. Support formation procedure
                      [14]
           collagenase  II  type,  and  Dulbecco’s  Modified  Eagle’s
           Medium (DMEM) media (these materials were purchased   The supporting part of the scaffold was located only in
           from PanEco, Russia) were used to dissolve the cartilage.   places of collagen ledges to optimize the printing process
           After the first step of isolation, the cleaned ribs were left   (printing time and amount of material). Thus, the general
           overnight in media with fetal bovine serum (Biosera,   outline (overall projection) of the entire thyroid cartilage
           France) at 4°C. On the next day, the isolation procedure   model on the XY-plane was not changed.
           was repeated, and then the cells were washed by two     A set of scaffold cross-sections was used to create
           cycles of precipitation and resuspension. The chondrocytes   the support. For the preliminary estimation, 2 mm step
           were cultivated in DMEM (4.5 g/l glucose) with serum,   was chosen (Figure  2A). The overall number of slices
           penicillin-streptomycin, and glutamine (both were   was 17. Each cross-section was extruded to the base of the
           purchased from PanEco, Russia) at 4°C and 5% CO . The   model. Thus, a general model for collagen and gelatin was
                                                      2
           cell culture was characterized by Alcian blue stain (Sigma-  obtained (Figure 2B). The support model was obtained by
           Aldrich) in accordance with Gosset et al. protocol . For   a Boolean operation of subtraction the model of thyroid
                                                     [15]
           the experiment, the second passage was used.        cartilage from a general model for collagen and gelatin.
               Biocompatibility  testing  was  conducted  for   The complete supporting part of the scaffold (Figure 2C)
           neutralized  collagen  gel  with 40 mg/ml  concentration   has 23,172 faces and a size of 47.7 × 41.0 × 34.0 mm.
           (recommended  for the study by the manufacturer)  in
           contrast to 80 mg/ml hydrogel that was used to verify the   3.2. Influence of cross-section number on the
           described  technique. The neutralization  buffer contains   quality of the support
           50  mM Tris-HCl  and  DMEM/F12  medium  (pH 8). To   The procedure described above included the use of 17
           examine  collagen  biocompatibility,  8 × 8 ×  0.2 mm   cross-sections with 2 mm step. The number of slices can
           scaffolds were printed. Printing parameters and conditions   vary depending on the given model. The data on the effect
           were the same as for the thyroid  cartilage  scaffold
           fabrication.  The  cell-laden  scaffolds were incubated  in   A             B
           the standard conditions for cell cultures. On the 3  and
                                                      rd
           7  days, the tissue scaffolds were analyzed using a Live/
            th
           Dead assay (Sigma-Aldrich) according to manufacturer
           protocol. The images were processed using ImageJ 1.52.
           2.6. Statistics
           Cell viability data were analyzed in R 3.5.3 (2019). The                    D
           error of cell viability  ratio was assessed in accordance   C
           with a Poisson distribution. Contingency table and Chi-
           square test were used to compare  cell  viability.  The
           difference was considered significant at P < 0.05.

           3. Results
           3.1. Human thyroid cartilage model
                                                               Figure  1.  Thyroid  cartilage  model  formation.  (A)  The  area  of
           The area of interest contouring for each slice was carried   interest at DICOM image (marked in red). (B) Model solid body.
           out manually (Figure 1A). The creation of the 3D model   (C and D) Support material location (yellow). Scale bar – 1 cm.
           106                         International Journal of Bioprinting (2021)–Volume 7, Issue 2