
Page 98 - IJB-7-2
P. 98
3D Printed and Ion Controllable Release
scaffolds were determined by a universal testing machine deviation (SD) and analyzed using Student’s t-test.
(E44.304, Mattes Industrial Systems Co., LTD, China). p < 0.05 was deemed to be statistically significant.
The hardness of the composite scaffolds was measured
using a microhardness tester (TMVS-2, Beijing Time 3 Results and discussions
High Technology Co., LTD, China).
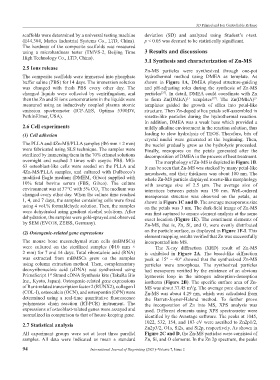
3.1 Synthesis and characterization of Zn-MS
2.5 Ions release
Zn-MS particles were synthesized through one-pot
The composite scaffolds were immersed into phosphate hydrothermal method using DMEA as template. As
buffer saline (PBS) for 14 days. The immersion solution shown in Figure 1A, DMEA played structure-guiding
was changed with fresh PBS every other day. The and pH-adjusting roles during the synthesis of Zn-MS
changed liquids were collected by centrifugation, and particles . In detail, DMEA could coordinate with Zn
[27]
then the Zn and Si ions concentrations in the liquids were to form Zn(DMEA) templates . The Zn(DMEA)
2+
2+
[17]
measured using an inductively coupled plasma atomic templates guided the growth of silica into petal-like
emission spectrometer (ICP-AES, Optima 5300DV, structure. Then Zn-doped silica petals self-assembled in
PerkinElmer, USA). rosette-like particles during the hydrothermal reaction.
In addition, DMEA was a weak base which provided a
2.6 Cell experiments mildly alkaline environment in the reaction solution, thus
(1) Cell adhesion leading to slow hydrolysis of TEOS. Therefore, bits of
crystal nuclei were generated at the beginning. Then,
The PLLA and 4Zn-MS/PLLA samples (Φ6 mm × 2 mm) the nuclei gradually grew as the hydrolysis proceeded.
were fabricated using SLS technique. The samples were Finally, mesopores on the petals generated after the
sterilized by immersing them in the 70% ethanol solutions decomposition of DMEA in the process of heat treatment.
overnight and washed 3 times with aseptic PBS. MG- The morphology of Zn-MS is depicted in Figure 1B.
63 osteoblast-like cells were seeded on the PLLA and It can be seen that Zn-MS was stacked by many petal-like
4Zn-MS/PLLA samples, and cultured with Dulbecco’s nanosheets, and their thickness was about 100 nm. The
modified Eagle medium (DMEM, Gibco) supplied with whole Zn-MS particle displayed rosette-like morphology
10% fetal bovine serum (FBS, Gibco). The culture with average size of 2.5 μm. The average size of
environment was at 37°C with 5% CO . The medium was interstices between petals was 150 nm. Well-ordered
2
changed every other day. When the culture time reached mesoporous structure was observed on the petals, as
1, 4, and 7 days, the samples containing cells were fixed shown in Figure 1C and D. The average mesoporous size
using 4 vol.% formaldehyde solution. Then, the samples on the petals was 3 nm. The dark-field image of Zn-MS
were dehydrated using gradient alcohol solutions. After was first captured to ensure element analysis at the same
dehydration, the samples were gold-sprayed and observed exact location (Figure 1E). The constituent elements of
by SEM (EVO18, ZEISS, Germany). Zn-MS, that is, Zn, Si, and O, were evenly distributed
(2) Osteogenic-related gene expressions on the particle surface, as displayed in Figure 1F-I. This
element mapping results verified that Zn was successfully
The mouse bone mesenchymal stem cells (mBMSCs) incorporated into MS.
were cultured on the sterilized samples (Φ10 mm × The X-ray diffraction (XRD) result of Zn-MS
2 mm) for 7 and 14 days. Total ribonucleic acid (RNA) is exhibited in Figure 2A. The bread-like diffraction
was extracted from mBMSCs grew on the samples peak at 15° – 40° showed that the synthesized Zn-MS
using column extraction method. Then, complementary particles were amorphous. The synthesized particles
deoxyribonucleic acid (cDNA) was synthesized using had mesopores verified by the existence of an obvious
PrimeScript 1 Strand cDNA Synthesis kits (TakaRa Bio hysteresis loop in the nitrogen adsorption-desorption
st
Inc., Kyoto, Japan). Osteogenic-related gene expressions isotherm (Figure 2B). The specific surface area of Zn-
of Runt-related transcription factor 2 (RUNX2), collagen I MS was about 37.45 m /g. The average pore diameter of
2
(COL-I), osteocalcin (OCN), and osteopontin (OPN) were Zn-MS was about 4.29 nm, which was calculated from
determined using a real-time quantitative fluorescence the Barrett-Joyner-Halend method. To further prove
polymerase chain reaction (RT-PCR) instrument. The the incorporation of Zn into MS, XPS analysis was
expressions of osteoblast-related genes were assayed and used. Different elements using XPS spectrometer were
normalized in comparison to that of house-keeping gene. identified by the Avantage software. The peaks at 1045,
1022, 532, 154, and 103 eV were ascribed to Zn2p1/2,
2.7 Statistical analysis Zn2p3/2, O1s, Si2s, and Si2p, respectively. As shown in
All experiment groups were set at least three parallel Figure 2C and D, the Zn-MS particles were consisted of
samples. All data were indicated as mean ± standard Zn, Si, and O elements. In the Zn 2p spectrum, the peaks
94 International Journal of Bioprinting (2021)–Volume 7, Issue 2