
Page 99 - IJB-7-2
P. 99
Qian, et al.
A
B C D
E F G H I
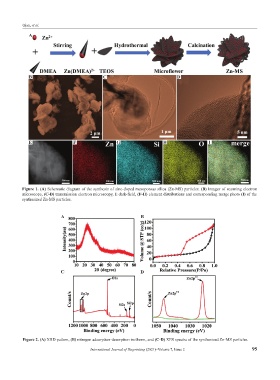
Figure 1. (A) Schematic diagram of the synthesis of zinc-doped mesoporous silica (Zn-MS) particles. (B) Images of scanning electron
microscope, (C-D) transmission electron microscopy, E dark-field, (F-H) element distributions and corresponding merge photo (I) of the
synthesized Zn-MS particles.
A A B B
C D
Figure 2. (A) XRD pattern, (B) nitrogen adsorption-desorption isotherm, and (C-D) XPS spectra of the synthesized Zn-MS particles.
International Journal of Bioprinting (2021)–Volume 7, Issue 2 95