
Page 116 - IJB-7-3
P. 116
Systematic Thermal Analysis for Accurately Predicting the Extrusion Printability
A B C
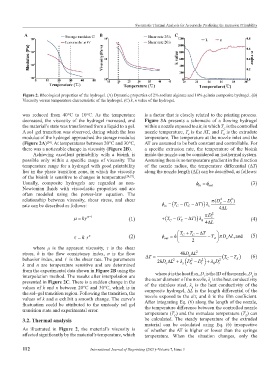
Figure 2. Rheological properties of the hydrogel. (A) Dynamic properties of 2% sodium alginate and 10% gelatin composite hydrogel. (B)
Viscosity versus temperature characteristic of the hydrogel. (C) k, n value of the hydrogel.
was reduced from 40°C to 10°C. As the temperature is a factor that is closely related to the printing process.
decreased, the viscosity of the hydrogel increased, and Figure 3A presents a schematic of a flowing hydrogel
the material’s state was transformed from a liquid to a gel. within a nozzle exposed to air, in which T is the controlled
C
A sol–gel transition was observed, during which the loss nozzle temperature, T is the AT, and T is the extrudate
E
A
modulus of the hydrogel approached the storage modulus temperature. The temperature at the nozzle inlet and the
(Figure 2A) . At temperatures between 20°C and 30°C, AT are assumed to be both constant and controllable. For
[24]
there was a noticeable change in viscosity (Figure 2B). a specific extrusion rate, the temperature of the bioink
Achieving excellent printability with a bioink is inside the nozzle can be considered an isothermal system.
possible only within a specific range of viscosity. The Assuming there is no temperature gradient in the direction
temperature range for a hydrogel with good printability of the nozzle radius, the temperature differential (∆T)
lies in the phase transition zone, in which the viscosity along the nozzle length (∆L) can be described, as follows:
of the bioink is sensitive to changes in temperature [24,27] .
Usually, composite hydrogels are regarded as non- out (3)
in
Newtonian fluids with viscoelastic properties and are
often modeled using the power-law equation. The
relationship between viscosity, shear stress, and shear D ( 2 D )
2
rate can be described as follows: T ( T T ) s o i
in
C
C
4 L
C
µ = kγ n− 1 (1) T ( T T ) h D i 2 (4)
C
4 L
C
C
k γ n (2) out h T T T T A D L ,and (5)
o
2
where μ is the apparent viscosity, τ is the shear
stress, k is the flow consistency index, n is the flow 4 hD o L 2 T (6)
C
behavior index, and γ is the shear rate. The parameters T hD L D D 2 T A
D
2
2
2
k and n are temperature sensitive and are determined 2 o s o i h i
from the experimental data shown in Figure 2B using the where ϕ is the heat flux, D is the ID of the nozzle, D is
interpolation method. The results after interpolation are the outer diameter of the nozzle, λ is the heat conductivity
i
o
presented in Figure 2C. There is a sudden change in the of the stainless steel, λ is the heat conductivity of the
s
values of k and n between 20°C and 30°C, which is in composite hydrogel, ∆L is the length differential of the
h
the sol–gel transition region. Following the transition, the nozzle exposed to the air, and h is the film coefficient.
values of k and n exhibit a smooth change. The curve’s After integrating Eq. (6) along the length of the nozzle,
fluctuation could be attributed to the unsteady sol–gel the temperature difference between the controlled nozzle
transition state and experimental error.
temperature (T ) and the extrudate temperature (T ) can
E
C
3.2. Thermal analysis be calculated. The steady temperature of the extruded
material can be calculated using Eq. (6) irrespective
As illustrated in Figure 2, the material’s viscosity is of whether the AT is higher or lower than the syringe
affected significantly by the material’s temperature, which temperature. When the situation changes, only the
112 International Journal of Bioprinting (2021)–Volume 7, Issue 3