
Page 121 - IJB-7-3
P. 121
Li, et al.
a synergistic consequence of various factors, including linewidth are shown in Figure S1 (Supplementary File).
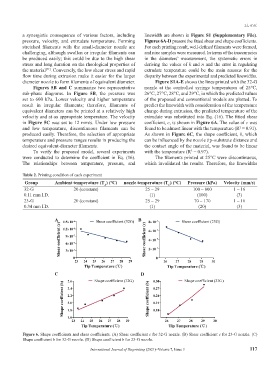
pressure, velocity, and extrudate temperature. Forming Figures 6A-D present the fitted shear and shape coefficients.
stretched filaments with the small-diameter nozzle are For each printing result, well-defined filaments were formed,
challenging, although swollen or irregular filaments can and nine samples were measured. In terms of the inaccuracies
be produced easily; this could be due to the high shear in the diameters’ measurement, the systematic errors in
stress and long duration on the rheological properties of deriving the values of k and n and the error in regulating
the material . Conversely, the low shear stress and rapid extrudate temperature could be the main reasons for the
[51]
flow time during extrusion make it easier for the larger disparity between the experimental and predicted linewidths.
diameter nozzle to form filaments of equivalent diameter. Figure S1A-E shows the lines printed with the 32-G
Figures 5B and C summarize two representative nozzle at the controlled syringe temperatures of 25°C,
sub-phase diagrams. In Figure 5B, the pressure was 26°C, 27°C, 28°C, and 29°C, in which the predicted values
set to 600 kPa. Lower velocity and higher temperature of the proposed and conventional models are plotted. To
result in irregular filaments; therefore, filaments of predict the linewidth with consideration of the temperature
equivalent diameters can be printed at a relatively high change during extrusion, the predicted temperature of the
velocity and at an appropriate temperature. The velocity extrudate was substituted into Eq. (16). The fitted shear
in Figure 5C was set to 12 mm/s. Under low pressure coefficient, c, is shown in Figure 6A. The value of c was
and low temperature, discontinuous filaments can be found to be almost linear with the temperature (R = 0.91).
2
produced easily. Therefore, the selection of appropriate As shown in Figure 6C, the shape coefficient, b, which
temperature and pressure ranges results in producing the can be influenced by the nozzle tip–substrate distance and
desired equivalent-diameter filaments. the contact angle of the material, was found to be linear
To verify the proposed model, several experiments with the temperature (R = 0.97).
2
were conducted to determine the coefficient in Eq. (16). The filaments printed at 25°C were discontinuous,
The relationships between temperature, pressure, and which invalidated the results. Therefore, the linewidths
Table 2. Printing condition of each experiment
Group Ambient temperature (T ) (℃) nozzle temperature (T ) (℃) Pressure (kPa) Velocity (mm/s)
C
A
32-G 20 (constant) 25 – 29 100 – 800 1 – 16
0.11 mm I.D. (1) (100) (3)
23-G 20 (constant) 25 – 29 70 – 170 1 – 16
0.34 mm I.D. (1) (20) (3)
A B
C D
Figure 6. Shape coefficients and shear coefficients. (A) Shear coefficient c for 32-G nozzle. (B) Shear coefficient c for 23-G nozzle. (C)
Shape coefficient b for 32-G nozzle. (D) Shape coefficient b for 23-G nozzle.
International Journal of Bioprinting (2021)–Volume 7, Issue 3 117