
Page 123 - IJB-7-3
P. 123
Li, et al.
A B
C D E
F G H
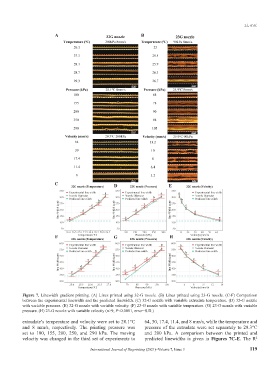
Figure 7. Linewidth gradient printing. (A) Lines printed using 32-G nozzle. (B) Lines printed using 23-G nozzle. (C-F) Comparison
between the experimental linewidth and the predicted linewidth. (C) 32-G nozzle with variable extrudate temperature. (D) 32-G nozzle
with variable pressure. (E) 32-G nozzle with variable velocity. (F) 23-G nozzle with variable temperature. (G) 23-G nozzle with variable
pressure. (H) 23-G nozzle with variable velocity (n>9, P<0.0001, error=S.D.)
extrudate’s temperature and velocity were set to 28.1°C 64, 30, 17.4, 11.4, and 8 mm/s, while the temperature and
and 8 mm/s, respectively. The printing pressure was pressure of the extrudate were set separately to 29.3°C
set to 100, 155, 200, 250, and 290 kPa. The moving and 200 kPa. A comparison between the printed and
velocity was changed in the third set of experiments to predicted linewidths is given in Figures 7C-E. The R 2
International Journal of Bioprinting (2021)–Volume 7, Issue 3 119