
Page 124 - IJB-7-3
P. 124
Systematic Thermal Analysis for Accurately Predicting the Extrusion Printability
values of these figures are 0.9744, 0.9757, and 0.9833, 3.5. Cell-laden scaffold fabrication
respectively (P<0.001). In this study, printability was represented by the shape
In addition, the 23-G nozzle was used to verify the
physical model and to print lines with a linewidth step. integrity and cell viability after printing. The rheological
properties of the bioinks (in Section 3.1) and the physical
With a nozzle diameter of 340 μm, the linewidth gradient models (in Section 3.3) provided the foundation for cell-
of the 23-G nozzle was 340, 390, 440, 490, and 540 μm. laden bioprinting. The effect of pressure and nozzle type
In the first set of experiments, the pressure and velocity had been explored previously and had confirmed that
were set at constants of 90 kPa and 8 mm/s, respectively. higher shear stresses result in lower cell viability [23,27] .
The extrudate’s theoretical temperature was calculated Therefore, the 23-G nozzle was adapted to investigate
according to Eq. (16) and was realized by regulating the influence of temperature on cell viability. Cell-laden
the nozzle temperature based on both Eq. (6) and the scaffolds were fabricated at different temperatures using a
thermal simulation. The extrudate temperature was bioink comprising sodium alginate–gelatin hydrogel and
regulated separately at 25°C, 25.5°C, 25.9°C, 26.3°C, HKs with a cell density of 3 × 10 /mL.
6
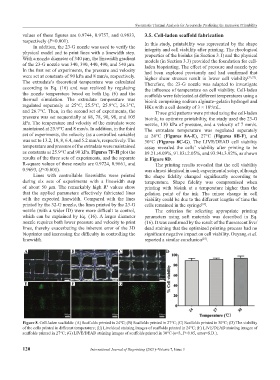
and 26.7°C. Then, in the second set of experiments, the Three grid patterns were printed using the cell-laden
pressure was set sequentially at 68, 78, 90, 98, and 105 bioink; to optimize printability, the study used the 23-G
kPa. The temperature and velocity of the extrudate were nozzle, 130 kPa of pressure, and a velocity of 7 mm/s.
maintained at 25.9°C and 8 mm/s. In addition, in the third The extrudate temperature was regulated separately
set of experiments, the velocity (as a controlled variable) at 24°C (Figures 8A-E), 27°C (Figures 8B-F), and
was set to 13.2, 10, 8, 6.4, and 5.2 mm/s, respectively. The 30°C (Figures 8C-G). The LIVE/DEAD cell viability
temperature and pressure of the extrudate were maintained assay revealed the cells’ viability after printing to be
as constants at 25.9°C and 90 kPa. Figures 7F-H plot the 89.21±4.09%, 91.83±2.05%, and 93.94±3.92%, as shown
results of the three sets of experiments, and the separate in Figure 8D.
R-square values of these results are 0.9724, 0.9661, and The printing results revealed that the cell viability
0.9693, (P<0.001). was almost identical in each experimental setup, although
Lines with controllable linewidths were printed the shape fidelity changed significantly according to
during six sets of experiments with a linewidth step temperature. Shape fidelity was compromised when
of about 50 μm. The remarkably high R values show printing with bioink at a temperature higher than the
2
that the applied parameters effectively fabricated lines gelation point of the ink. The minor change in cell
with the expected linewidth. Compared with the lines viability could be due to the different lengths of time the
printed by the 32-G nozzle, the lines printed by the 23-G cells remained in the syringe .
[25]
nozzle (with a wider ID) were more difficult to control, The criterion for selecting appropriate printing
which can be explained by Eq. (16). A larger diameter parameters using soft materials was described in Eq.
nozzle requires both lower pressure and velocity to print (16). It was confirmed by the result of the fluorescent live/
lines, thereby exacerbating the inherent error of the 3D dead staining that the optimized printing process had no
bioprinter and increasing the difficulty in controlling the significant negative impact on cell viability. Ouyang et al.
linewidth. reported a similar conclusion .
[27]
A B C D
E F G
Figure 8. Cell-laden scaffolds: (A) Scaffolds printed in 24℃; (B) Scaffolds printed in 27℃; (C) Scaffolds printed in 30℃; (D) The viability
of the cells printed in different temperature; (E) Live/dead staining images of scaffolds printed in 24℃; (F) LIVE/DEAD staining images of
scaffolds printed in 27℃; (G) LIVE/DEAD staining images of scaffolds printed in 30℃ (n=3, P>0.05, error=S.D.).
120 International Journal of Bioprinting (2021)–Volume 7, Issue 3