
Page 120 - IJB-7-3
P. 120
Systematic Thermal Analysis for Accurately Predicting the Extrusion Printability
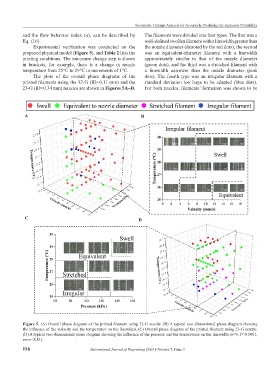
and the flow behavior index (n), can be described by The filaments were divided into four types. The first was a
Eq. (16). well-defined swollen filament with a linewidth greater than
Experimental verification was conducted on the the nozzle diameter (denoted by the red dots), the second
proposed physical model (Figure 5), and Table 2 lists the was an equivalent-diameter filament with a linewidth
printing conditions. The minimum change step is shown approximately similar to that of the nozzle diameter
in brackets, for example, there is a change in nozzle (green dots), and the third was a stretched filament with
temperature from 25°C to 29°C in increments of 1°C. a linewidth narrower than the nozzle diameter (pink
The plots of the overall phase diagrams of the dots). The fourth type was an irregular filament with a
printed filaments using the 32-G (ID=0.11 mm) and the standard deviation too large to be adapted (blue dots).
23-G (ID=0.34 mm) nozzles are shown in Figures 5A–D. For both nozzles, filaments’ formation was shown to be
A B
C D
Figure 5. (A) Overall phase diagram of the printed filament using 32-G nozzle. (B) A typical two-dimensional phase diagram showing
the influence of the velocity and the temperature on the linewidth. (C) Overall phase diagram of the printed filament using 23-G nozzle.
(D) A typical two-dimensional phase diagram showing the influence of the pressure and the temperature on the linewidth (n=9, P<0.0001,
error=S.D.).
116 International Journal of Bioprinting (2021)–Volume 7, Issue 3