
Page 149 - IJB-7-3
P. 149
Zhou, et al.
Whereas the results of P1 (34.5 and 38.0°C) shown behavior of P1 was much less affected by the salting-
obvious differences with those in the phase diagram (35 out effect than that of P4DA, and no gel-precipitation
and 43°C). This situation was likely due to a continuous transition was observed (Figure S3A).
increase of system viscosity even G’ was overtaken by A mixing strategy was employed to prepare a series
G’’ after 38.0°C. of samples with different P4DA content to evaluate the
The salting-out effect of the photoinitiator (LAP) extent of photo-crosslinking on the printability of inks.
on the sol-gel transition behavior of P1 and P4DA was For this purpose, six samples of DA00, DA20, DA40,
also examined. As shown in Figure S3, T and T of the DA60, DA80, and DA100 were prepared by blending
sol
gel
P4DA were found to be decreased once LAP was added P1 with P4DA, the number represented the fraction of
to the solutions. In addition, G’ and G’’ of P4DA dropped P4DA in the total copolymer. All of those samples were
sharply when the temperature was elevated above T , then evaluated with rheological tests, and the calculated
sol
indicating a gel-precipitation process instead of a gel-sol T and T are shown in Figure 2E. Both T and T
gel
sol
gel
sol
transition (Figure S3B). In contrast, the sol-gel transition were linearly increased with the fraction of P4DA, and
Table 1. Molecular characterization and gelation information of synthesized triblock copolymers
Samples M n a LA/GA a Ð b CGC/wt % c Gel window/°C c
P1 2102-1500-2102 1/0.97 1.27 16 35 – 43
P2 1790-1500-1790 1/1.00 1.33 22 39 – 41
P3 1495-1500-1495 1/1.00 1.23 32 -
P4 1345-1500-1345 1/0.97 1.23 - -
P4DA 1627-1500-1627 1/0.99 1.25 22 42 – 48
a Number-average molecular weight (M ) and the molar ratio of lactide/glycolide (LA/GA) were calculated from H NMR spectroscopy. Molar-mass
1
b
n
dispersity (Đ) was measured via GPC. Critical gelation concentration (CGC) was acquired from phase diagrams and the gel window showed a gelation
c
temperature range at concentration of 25 wt.%
A B C
D E
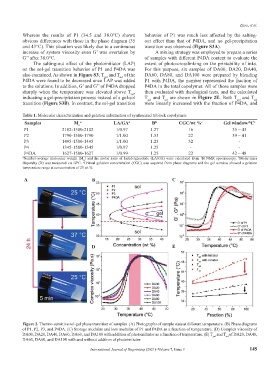
Figure 2. Thermo-sensitive sol-gel phase transition of samples. (A) Photographs of sample state at different temperature. (B) Phase diagrams
of P1, P2, P3, and P4DA. (C) Storage modulus and loss modulus of P1 and P4DA as a function of temperature. (D) Complex viscosity of
DA00, DA20, DA40, DA60, DA60, and DA100 with addition of photoinitiator as a function of temperature. (E) T and T of DA20, DA40,
gel
sol
DA60, DA60, and DA100 with and without addition of photoinitiator.
International Journal of Bioprinting (2021)–Volume 7, Issue 3 145