
Page 145 - IJB-7-4
P. 145
Mei, et al.
A B
C D
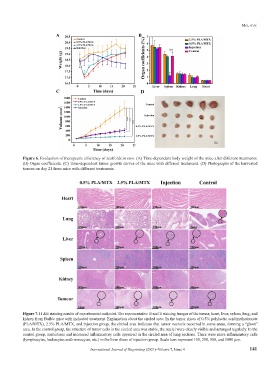
Figure 6. Evaluation of therapeutic efficiency of scaffolds in vivo. (A) Time-dependent body weight of the mice after different treatments.
(B) Organ coefficients. (C) Time-dependent tumor growth curves of the mice with different treatments. (D) Photographs of the harvested
tumors on day 21 from mice with different treatments.
Figure 7. H &E staining results of experimental endpoint. The representative H and E staining images of the tumor, heart, liver, spleen, lung, and
kidney from Balb/c mice with indicated treatment. Explanation about the circled area: In the tumor slices of 0.5% polylactic acid/methotrexate
(PLA/MTX), 2.5% PLA/MTX, and injection group, the circled area indicates that tumor necrosis occurred in some areas, forming a “ghost”
area. In the control group, the structure of tumor cells in the circled area was stable, the nuclei were clearly visible and arranged regularly. In the
control group, metastases and increased inflammatory cells appeared in the circled area of lung sections. There were more inflammatory cells
(lymphocytes, leukocytes and monocytes, etc.) in the liver slices of injection group. Scale bars represent 100, 250, 500, and 1000 μm.
International Journal of Bioprinting (2021)–Volume 7, Issue 4 141