
Page 41 - IJB-8-1
P. 41
Ng, et al.
cell-laden droplets at nanoliter droplets with high cell (0 – 5 million cells/mL). In general, the cell-laden bio-
viability. The cell-laden droplets were printed at 1 kHz inks can be categorized into 3 distinct classifications
frequency into tissue-treated 12-well plates to obtain 8 based on the cell volume fraction ɸ : dilute bio-inks (ɸ
[41]
× 8 array of droplets (varying total dispensed volume of ≤ 2%), semi-dilute bio-inks (ɸ ≤ 25%), and concentrated
20, 30, and 40 nL per droplet position). The total printing bio-inks (ɸ > 25%). The cell diameter of the HDFs is
time for each study was limited to <1 min, and the time ~18.2 ± 1.6 µm, and the cell volume fractions of the
taken for this evaporation study was measured at the cell-laden bio-inks (1 – 5 million cells/mL) used in
start of printing. The viability of printed arrays of cell- this study were 0.337%, 0.674%, 1.011%, 1.348%, and
laden droplets (20 nL, 30 nL and 40 nL per spot) was 1.685%, respectively. Hence, the cell-laden bio-inks
evaluated by adding the Live/Dead Viability/Cytotoxicity used in this study are considered dilute bio-inks. The
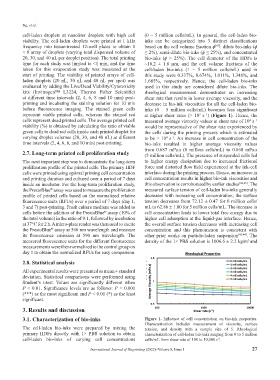
kits (Invitrogen™ L3224, Thermo Fisher Scientific) rheological measurement demonstrates an increasing
at different time intervals (2, 4, 6, 8 and 10 min) post- shear rate that results in lower average viscosity, and the
printing and incubating the staining solution for 10 min decrease in bio-ink viscosities for all the cell-laden bio-
before fluorescence imaging. The stained green cells inks (0 – 5 million cells/mL) becomes less significant
represent viable printed cells, whereas the stained red at higher shear rates (> 10 s ) (Figure 1). Hence, the
−1
3
cells represent dead printed cells. The average printed cell measured average viscosity values at shear rate of 10 s −1
4
viability (%) is obtained by calculating the ratio of viable would be representative of the shear rate experienced by
green cells to dead red cells inside each printed droplet for the cells during the printing process which is estimated
varying droplet volumes (20, 30, and 40 nL) at different to be > 10 s . An increase in cell concentration of the
4
−1
time intervals (2, 4, 6, 8, and 10 min) post-printing. bio-inks resulted in higher average viscosity values
from 0.687 mPa.s (0 million cells/mL) to 0.868 mPa.s
2.7. Long-term printed cell proliferation study (5 million cells/mL). The presence of suspended cells led
The next important step was to demonstrate the long-term to higher energy dissipation due to increased frictional
proliferation profile of the printed cells. The primary HDF force and distorted flow field experienced at the ink-cell
cells were printed using optimal printing cell concentration interface during the printing process. Hence, an increase in
and printing duration and cultured over a period of 7 days cell concentration results in higher bio-ink viscosities and
inside an incubator. For the long-term proliferation study, this observation is corroborated by earlier studies [42,43] . The
the PrestoBlue assay was used to measure the proliferation measured surface tension of cell-laden bio-inks generally
®
profile of printed cells based on the normalized relative decreases with increasing cell concentration; the surface
fluorescence units (RFUs) over a period of 7 days (day 1, tension decreases from 72.12 ± 0.47 for 0 million cells/
3 and 7) post-printing. Fresh culture medium was added to mL to 62.86 ± 1.00 for 5 million cells/mL. The increase in
cells before the addition of the PrestoBlue assay (10% of cell concentration leads to lower total free energy due to
®
the total volume) in the ratio of 9:1, followed by incubation higher cell adsorption at the liquid-gas interface. Hence,
at 37°C for 2 h. A micro-plate reader was then used to excite the overall surface tension decreases with increasing cell
the PrestoBlue assay at 560 nm wavelength and measure concentration and this phenomenon is consistent with
®
its fluorescence emission at 590 nm wavelength. The other prior works on particle-laden suspension [42-44] . The
measured fluorescence units for the different fluorescence density of the 1× PBS solution is 1006.6 ± 2.2 kg/m and
3
measurements were then normalized to the control group on
day 1 to obtain the normalized RFUs for easy comparison.
2.8. Statistical analysis
All experimental results were presented as mean ± standard
deviation. Statistical comparisons were performed using
Student’s t-test. Values are significantly different when
P < 0.01. Significance levels are as follows: P < 0.001
(***) as the most significant and P < 0.01 (*) as the least
significant.
3. Results and discussion
3.1. Characterization of bio-inks Figure 1. Influence of cell concentration on bio-ink properties.
The cell-laden bio-inks were prepared by mixing the Characterization includes measurement of viscosity, surface
tension, and density with a sample size of 5. Rheological
primary HDFs directly with 1× PBS solution to obtain characterization of cell-laden bio-inks ranging from 0 to 5 million
cell-laden bio-inks of varying cell concentrations cells/mL from shear rate of 100 to 10,000 s .
−1
International Journal of Bioprinting (2022)–Volume 8, Issue 1 27