
Page 44 - IJB-8-1
P. 44
Controlling Droplet Impact Velocity and Droplet Volume Improves Cell Viability in Droplet-Based Bioprinting
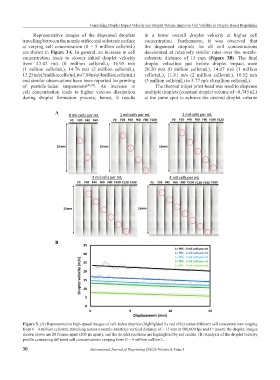
Representative images of the dispensed droplets in a lower overall droplet velocity at higher cell
travelling between the nozzle orifice and substrate surface concentration. Furthermore, it was observed that
at varying cell concentration (0 – 5 million cells/mL) the dispensed droplets for all cell concentrations
are shown in Figure 3A. In general, an increase in cell decelerated at relatively similar rates over the nozzle-
concentration leads to slower initial droplet velocity substrate distance of 15 mm (Figure 3B). The final
from 23.43 m/s (0 million cells/mL), 16.95 m/s droplet velocities just before droplet impact were
(1 million cells/mL), 14.76 m/s (2 million cells/mL), 20.20 m/s (0 million cells/mL), 14.07 m/s (1 million
13.25 m/s (3 million cells/mL) to 7.84 m/s (4 million cells/mL) cells/mL), 11.81 m/s (2 million cells/mL), 10.52 m/s
and similar observations have been reported for printing (3 million cells/mL) to 5.77 m/s (4 million cells/mL).
of particle-laden suspensions [45,48] . An increase in The thermal inkjet print-head was used to dispense
cell concentration leads to higher viscous dissipation multiple droplets (constant droplet volume of ~0.345 nL)
during droplet formation process; hence, it results at the same spot to achieve the desired droplet volume
A
B
Figure 3. (A) Representative high-speed images of cell-laden droplets (highlighted by red cirle) under different cell concentrations ranging
from 0 – 4 million cells/mL travelling across a nozzle-substrate vertical distance of ~ 15 mm at 100,000 fps and 1× zoom; the droplet images
shown above are 20 frames apart (200 µs apart), and the droplet positions are highlighted by red circles. (B) Analysis of the droplet velocity
profile containing different cell concentrations ranging from 0 – 4 million cells/mL.
30 International Journal of Bioprinting (2022)–Volume 8, Issue 1