
Page 43 - IJB-8-1
P. 43
Ng, et al.
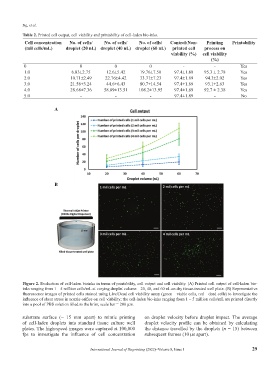
Table 2. Printed cell output, cell viability and printability of cell-laden bio-inks.
Cell concentration No. of cells/ No. of cells/ No. of cells/ Control:Non- Printing Printability
(mil cells/mL) droplet (20 nL) droplet (40 nL) droplet (60 nL) printed cell process on
viability (%) cell viability
(%)
0 0 0 0 - - Yes
1.0 6.83±2.75 12.6±5.42 19.76±7.50 97.4±1.89 95.3 ± 2.78 Yes
2.0 10.71±2.49 22.76±4.42 33.71±7.23 97.4±1.89 94.3±2.02 Yes
3.0 21.56±3.24 44.6±6.43 80.7±14.54 97.4±1.89 93.1±2.63 Yes
4.0 28.68±7.36 58.89±13.51 108.2±13.95 97.4±1.89 92.7 ± 2.38 Yes
5.0 - - - 97.4±1.89 - No
A
B
Figure 2. Evaluation of cell-laden bioinks in terms of printability, cell output and cell viability. (A) Printed cell output of cell-laden bio-
inks ranging from 1 – 5 million cells/mL at varying droplet volume – 20, 40, and 60 nL on dry tissue-treated well plate. (B) Representative
fluorescence images of printed cells stained using Live/Dead cell viability assay (green – viable cells, red – dead cells) to investigate the
influence of shear stress in nozzle orifice on cell viability; the cell-laden bio-inks ranging from 1 – 5 million cells/mL are printed directly
into a pool of PBS solution filled to the brim; scale bar = 200 µm.
substrate surface (~ 15 mm apart) to mimic printing on droplet velocity before droplet impact. The average
of cell-laden droplets into standard tissue culture well droplet velocity profile can be obtained by calculating
plates. The high-speed images were captured at 100,000 the distance travelled by the droplets (n = 15) between
fps to investigate the influence of cell concentration subsequent frames (10 µs apart).
International Journal of Bioprinting (2022)–Volume 8, Issue 1 29