
Page 148 - IJB-8-2
P. 148
Laser printing of Gemcitabine on microneedles
mice were treated with MNs loaded with 10 mg/mL of 250 mJ/cm ) were investigated to evaluate the process and
2
Gem while mice in another two groups were injected select the optimum printing conditions. LIFT did not occur
2
with 10 mg/mL of Gem IP; both dosing routes resulted at fluences below 380 mJ/cm and above 1530 mJ/cm ,
2
in 100 μg dose. where the laser energy either produced a small jet and
Blood was collected from the mouse cheek 15 did not transfer the material (subthreshold regime), or it
and 60 min after MN application or IP injection. Blood produced a large jet causing a violent ejection of material
was placed in heparinized Eppendorf tubes, containing leading to a disorderly transfer (splashing regime). In the
10 μL heparin (5000 iu/mL), which were then placed duration of laser transfer, the material that forms the jet is
immediately on ice and centrifuged for 10min at not subjected to any mechanical stress and even though
3000 rpm. Plasma was then stored in a −80°C freezer it suffers thermal stress, it only happens during the first
[36]
prior to analysis. Mice were then euthanized. few nanometres of bubble formation which does not
Plasma samples (50 μL) were prepared for influence the quality of the transferred material. High-
quantification by protein precipitation with the addition quality laser transfer of a single droplet can only happen
of cold ACN, centrifugation, and evaporation to dryness in a narrow range of laser fluences which correspond to
[37]
based on previously reported approach . Gem was the optimal regime . In these experiments, the optimum
[31]
2
determined and quantified by LC-MS/MS analysis laser fluence was found between 390 and 450 mJ/cm , as
as described (see section 2.7). This methodology presented in Figure 4.
provided a linear calibration curve with a range of The impact velocity (0.8 m/s) was calculated by a
100–5000 ng/mL for the quantification of Gem in the linear fit of the propagation length of the jet front before
obtained plasma samples. impact as a function of the elapsed time of the successive
frames captured from the videos. Figure 5 presents
3. Results snapshots taken during the printing process by a high-
speed camera at four different fluences where successful
3.1. LIFT printing of Gem solutions transfer of the Gem solution occurred.
The direct transfer of the API solution via LIFT printing, The droplet size increases with increasing fluence,
which relies on the high velocity and pressure that the while higher fluences lead to higher droplet size
liquid droplets have an impact with the MNs substrate, variation. This may lead to non-uniform deposition film
was achieved, resulting in a physical adsorption of the causing the API not to be distributed evenly on the MN
materials onto the substrate. Two-dimensional patterns patches. It should also be noted that the LIFT technique
[38]
of continuous Gem layers were printed on the MNs by has the ability to precisely print very small droplets
adjusting the droplet-to-droplet distance to create an even (< 100 pL) of liquids on each MN by adjusting the spot
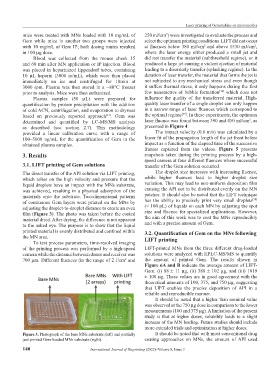
film (Figure 3). The photo was taken before the coated size and fluence for specialized applications. However,
material dried. After drying, the difference is not apparent the aim of this work was to coat the MNs reproducibly
to the naked eye. The purpose is to show that the liquid and with a precise amount of Gem.
printed material is evenly distributed and confined within 3.2. Quantification of Gem on the MNs following
the MN area. LIFT printing
To test process parameters, time-resolved imaging
of the printing process was performed by a high-speed LIFT-printed MNs from the three different drug-loaded
camera while the distance between donor and receiver was solutions were analyzed with HPLC-MS/MS to quantify
700 μm. Different fluences (in the range of 2 J/cm and the amount of printed Gem. The results shown in
2
Figure 6A and B indicate the average amount of LIFT-
Gem: (i) 88 ± 11 μg, (ii) 388 ± 102 μg, and (iii) 1019
± 100 μg. These values are in good agreement with the
theoretical amounts of 100, 375, and 750 μg, suggesting
that LIFT enables the precise deposition of API in a
reliable and reproducible manner.
It should be noted that a higher than nominal value
was observed at the 750 μg dose in comparison to the lower
measurements (100 and 375 μg). A limitation of the present
study is that at higher doses, solubility leads to a slight
increase of the MN loading. Future studies should include
more extended trials and optimization at higher doses.
Figure 3. Photograph of the bare MNs substrate (left) and partially It should be noted that with most conventional drug
just printed Gem-loaded MNs substrate (right). coating approaches on MNs, the amount of API used
140 International Journal of Bioprinting (2022)–Volume 8, Issue 3