
Page 146 - IJB-8-2
P. 146
Laser printing of Gemcitabine on microneedles
studies, since low, medium, high concentrations of drug a computer-controlled x–y translation stage with 1 μm
had to be achieved in a non-toxic solvent system that was positioning resolution and a LabVIEW program was used
compatible with the LIFT technology. to synchronize the x–y motion with the laser. The laser
Since Gem is highly soluble in H O (>50 mg/mL), beam was controlled by an attenuator while the size of
2
we initially tested a range of Gem concentrations (60- the beam could be adjusted through a variable circular
80 mg/mL) at 100% H O to find the highest soluble mask. Consequently, a ×15 plano-convex lens was used
2
concentration. Subsequently, we tested a series of Gem to focus the laser beam on a donor substrate. The donor
concentrations (60-80 mg/mL) in a mixture of H O with a substrate was a 1-inch quartz plate coated with a Ti film
2
small amount of glycerol (10%). Glycerol contributes to laser absorbing interlayer, onto which 10 μl of the three
the proper LIFT printing process. Finally, we found that Gem solutions (100 μg, 375 μg, and 750 μg) were drop
75 mg/mL was the highest soluble concentration of Gem cast. By focusing the laser beam onto the donor substrate,
in a H O: Glycerol solution (90:10 v: v). a high-pressure vapor pocket is created in the interface
2
between the Ti layer and the deposited API solution, due
2.3. MN array fabrication to the absorption of the laser pulse from the Ti layer of
MN arrays were produced as previously reported using the donor. This high-pressure vapor pocket expands
[6]
(PMMA, MW 120k, Sigma-Aldrich) which was dissolved and propels the supernatant fluid creating a dynamic jet
at 30 w/v% in ethyl lactate (≥98%, Sigma-Aldrich) for which drives the API solution to the receiver substrate
1.5 h at 150°C. The MN molds (Micropoint Technologies) with a high impact velocity, resulting in an nL droplet
contained 100 pyramidical cavities with base length and of Gem solution printed onto the MN substrates for each
height of 200 μm and 600 μm, respectively. 50 mg of laser beam pulse. The distance between the donor and the
30 w/v% PMMA was casted on the MN mold, centrifuged receiver substrates is 700 μm. The laser transfer resulted in
for 30 min at 3500 rpm, and left to dry overnight in the a continuous Gem film (5 × 5 mm) on the MNs substrate.
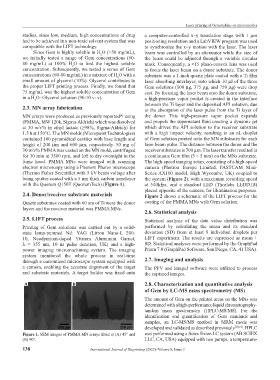
fume hood. PMMA MNs were imaged with scanning The high-speed imaging setup, consisting of a high-speed
electron microscopy using a Phenom Pharos microscope camera (Photron Europe Limited, FASTCAM Mini-
(Thermo Fisher Scientific) with 5 kV beam voltage after Series AX100 model, High Wycombe, UK) coupled to
being sputter-coated with a 5 nm thick carbon nanolayer the system (Figure 2); with a maximum recording speed
with the Quorum Q150T (QuorumTech) (Figure 1). at 540kfps, and a standard LED (Thorlabs LEDD1B)
placed opposite of the camera, for illumination purposes.
2.4. Donor/receiver substrate materials Figure 2 shows a schematic of the LIFT process for the
Quartz substrates coated with 60 nm of Ti were the donor coating of the PMMA MNs with Gem solution.
layers and the receiver material was PMMA MNs.
2.6. Statistical analysis
2.5. LIFT process Statistical analysis of the data value distribution was
Printing of Gem solutions was carried out by a solid- performed by calculating the mean and its standard
state lamp-pumped Nd: YAG (Litron Nano-L 200- deviation (SD) from at least 9 individual droplets per
10, Neodymium-doped Yttrium Aluminum Garnet, LIFT experiment. The results are expressed as mean ±
λ = 355 nm, 10 ns pulse duration, UK) and a high- SD. Statistical analyses were performed by the GraphPad
power imaging micromachining system. The imaging Prism 7.0 (GraphPad Software, San Diego, CA, 41 USA).
system monitored the whole process in real-time
through a customized microscope system equipped with 2.7. Imaging and analysis
a camera, enabling the accurate alignment of the target The PFV and ImageJ software were utilized to process
and substrate materials. A target holder was fixed onto the captured images.
A B 2.8. Characterization and quantitative analysis
of Gem by LC-MS mass spectrometry (MS)
The amount of Gem on the printed areas on the MNs was
determined with a high-performance liquid chromatography-
tandem mass spectrometry (HPLC-MS/MS). For the
identification and quantification of Gem standards and
samples, an LC-MS/MS method in MRM mode was
developed and validated as described previously [30,31] . HPLC
Figure 1. SEM images of PMMA MN arrays tilted at (A) 45° and was performed using a Sciex Exion LC system (AB SCIEX
(B) 90°. LLC, CA, USA) equipped with two pumps, a temperature-
138 International Journal of Bioprinting (2022)–Volume 8, Issue 3