
Page 149 - IJB-8-2
P. 149
Kanaki, et al.
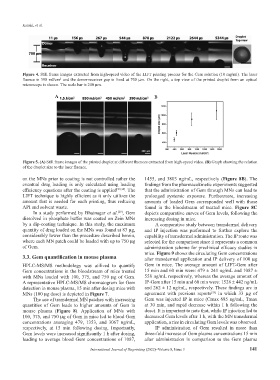
Figure 4. Still frame images extracted from high-speed video of the LIFT printing process for the Gem solution (10 mg/ml). The laser
2
fluence is 390 mJ/cm and the donor-receiver gap is fixed at 700 μm. On the right, a top view of the printed droplet from an optical
microscope is shown. The scale bar is 200 μm.
A B
Figure 5. (A) Still frame images of the printed droplet at different fluences extracted from high-speed video. (B) Graph showing the relation
of the droplet size to the laser fluence.
on the MNs prior to coating is not controlled rather the 1455, and 3803 ng/mL, respectively (Figure 8B). The
eventual drug loading is only calculated using loading findings from the pharmacokinetic experiments suggested
efficiency equations after the coating is applied [29,34] . The that the administration of Gem through MNs can lead to
LIFT technique is highly efficient as it only utilizes the prolonged systemic exposure. Furthermore, increasing
amount that is needed for each printing, thus reducing amounts of loaded Gem corresponded well with those
API and solvent waste. found in the bloodstream of treated mice. Figure 8C
In a study performed by Bhatnagar et al. , Gem depicts comparative curves of Gem levels, following the
[29]
dissolved in phosphate buffer was coated on Zein MNs increasing dosing in mice.
by a dip-coating technique. In this study, the maximum A comparative study between transdermal delivery
quantity of drug loaded on the MNs was found at 83 μg, and IP injection was performed to further explore the
considerably lower than the procedure described herein, capability of transdermal administration. The IP route was
where each MN patch could be loaded with up to 750 μg selected for the comparison since it represents a common
of Gem. administration scheme for preclinical efficacy studies in
mice. Figure 9 shows the circulating Gem concentrations
3.3. Gem quantification in mouse plasma after transdermal application and IP delivery of 100 μg
HPLC-MS/MS methodology was utilized to quantify Gem in mice. The average amount of LIFT-Gem after
Gem concentrations in the bloodstream of mice treated 15 min and 60 min were: 479 ± 241 ng/mL and 1087 ±
with MNs loaded with 100, 375, and 750 μg of Gem. 558 ng/mL respectively, whereas the average amount of
A representative HPLC-MS/MS chromatogram for Gem IP-Gem after 15 min and 60 min were: 1528 ± 442 ng/mL
detection in mouse plasma, 15 min after dosing mice with and 262 ± 12 ng/mL, respectively. These findings are in
[33]
MNs (100 μg dose) is depicted in Figure 7. agreement with previous reports in which 33 μg of
The use of transdermal MN patches with increasing Gem was injected IP in mice (Cmax 685 ng/mL, Tmax
quantities of Gem leads to higher amounts of Gem in at 30 min, and rapid decrease within 1 h following the
mouse plasma (Figure 8). Application of MNs with dose). It is important to note that, while IP injection led to
100, 375, and 750 μg of Gem in mice led to blood Gem decreased Gem levels after 1 h, with the MN transdermal
concentrations averaging 479, 1353, and 3067 ng/mL, application, a rise in circulating Gem levels was observed.
respectively, at 15 min following dosing. Importantly, IP administration of Gem resulted in more than
Gem levels were increased significantly 1 h after dosing, three-fold increase of Gem plasma concentrations 15 min
leading to average blood Gem concentrations of 1087, after administration in comparison to the Gem plasma
International Journal of Bioprinting (2022)–Volume 8, Issue 3 141